By using tdwi.org website you agree to our use of cookies as described in our cookie policy. Learn More

TDWI Upside - Where Data Means Business

Data Stories: Holiday Shopping, Seasonal Injuries, Christmas Music

These data visualizations explore shopping in Berlin, how people are hurt putting up decorations, and when people listen to Christmas music.


Festive Shopping

sample of data visualization, linked to full visualization at Datawrapper 

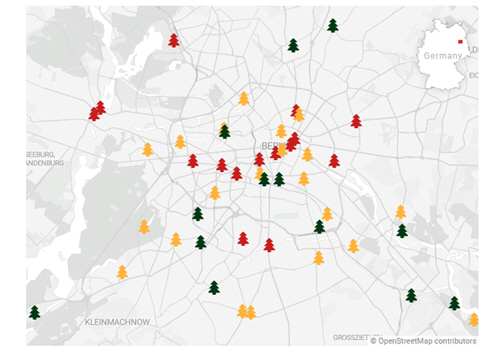
This interactive map from Datawrapper shows this year’s traditional Christmas markets in Berlin.


Careful Putting Up Those Lights!

sample of data visualization, linked to full visualization at Cannon Law 

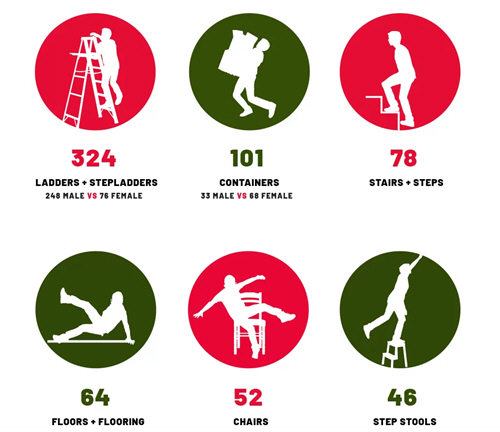
This article from a legal firm contains several charts and infographics showing the rates of injury over the holiday season. 


Make My Wish Come True

sample of data visualization, linked to full visualization at NBC 

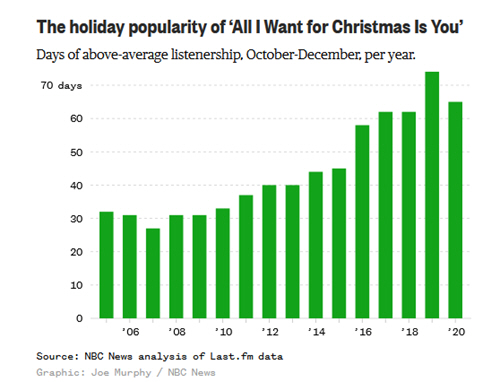
The charts in this article from NBC show that people are listening to Mariah Carey’s hit “All I Want for Christmas Is You” earlier each year.


TDWI Membership

Accelerate Your Projects,
and Your Career

TDWI Members have access to exclusive research reports, publications, communities and training.

Individual, Student, and Team memberships available.