By using tdwi.org website you agree to our use of cookies as described in our cookie policy. Learn More

TDWI Upside - Where Data Means Business

Data Stories: People and Things in Space

Using visualizations to understand asteroids, space flight, and the ISS.


Wave as the Rocks Fly Past

sample of data visualization, linked to full visualization at Planetary.org 

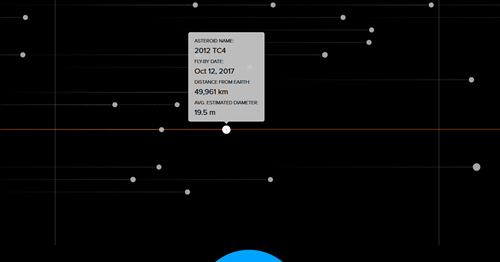
This interactive visualization shows how close asteroids frequently come to Earth. (Don’t worry, the dots aren’t to scale.)


Humans in Orbit

sample of data visualization, linked to full visualization at Tableau 

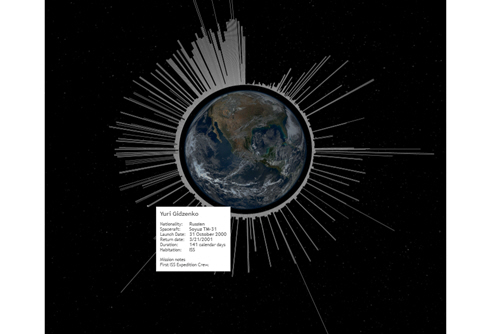
Hover over this Tableau visualization to explore the history of human space flight. You can see how frequently flights bring staff to the International Space Station (ISS), and click a small arrow in the bottom right for more graphics.


Around the World in 90 Minutes

sample of data visualization, linked to full visualization at Engaging Data 

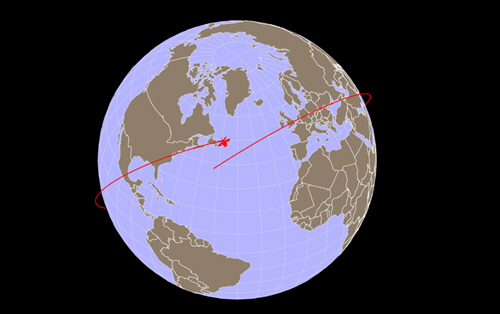
Where is the ISS now? This webpage shows its current location and can animate its future path around the world.

TDWI Membership

Accelerate Your Projects,
and Your Career

TDWI Members have access to exclusive research reports, publications, communities and training.

Individual, Student, and Team memberships available.