
Data Stories: Down Payments, Real Estate, and Building Trends
Trends in the housing market, where real estate is most and least expensive, and what’s going on with lumber prices.
- By Upside Staff
- October 13, 2021
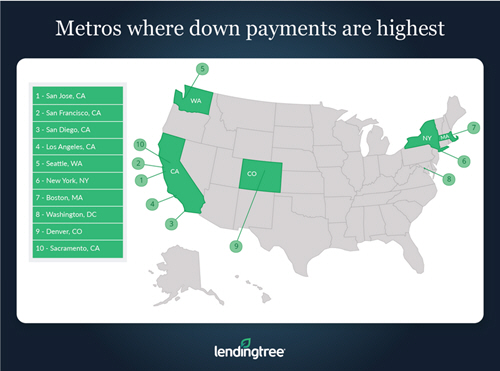
LendingTree recently looked at current down payments across the U.S., finding that in the 50 largest metro areas, the average down payment on a house is about 62 percent of the area’s median yearly household income.
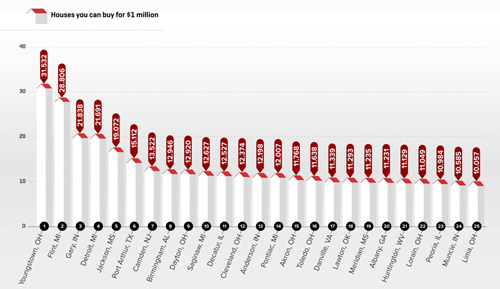
Earlier this year, Rate.com conducted its own research to show where a buyer can get the most real estate for a million dollars based on the median home value per square foot.
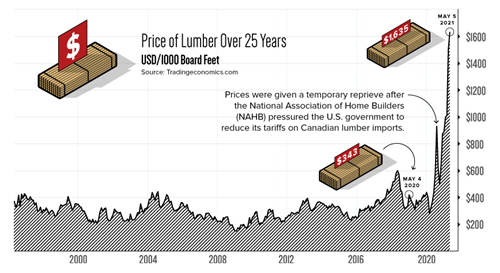
One of the factors recently affecting the real estate market is extreme changes in materials prices. Visual Capitalist illustrated the record highs the lumber market reached in spring of 2021. (Lumber prices have since crashed and are now rising again.)