
Data Stories: U.S. Religious Trends and Diversity
Data visualizations explore religious trends across the U.S. and illustrate diversity in religion and heritage.
- By Upside Staff
- April 21, 2021
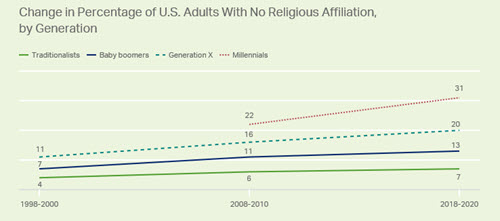
Recent polling from Gallup shows that church membership in the U.S. continues to fall. This article uses multiple charts and graphs to illustrate the data along various dimensions.
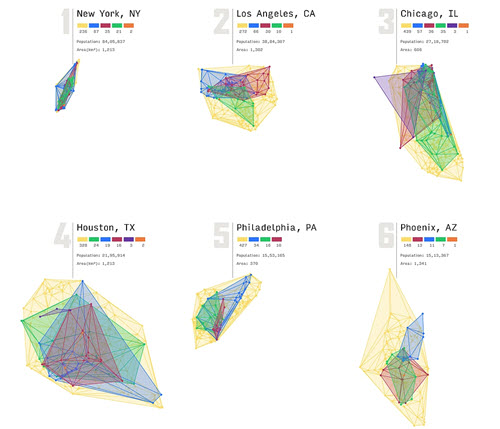
These colorful images are an experiment in using data visualization to look at the religious diversity of cities in a new way.
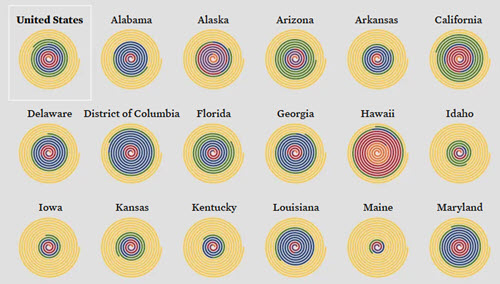
Another experiment in unique chart types, this infographic shows race and ethnic origin for the population of each U.S. state.