
Data Stories: Looking Back with Data
A snapshot of employment trends, animating pandemic data, and the year in search terms.
- By Upside Staff
- January 13, 2021
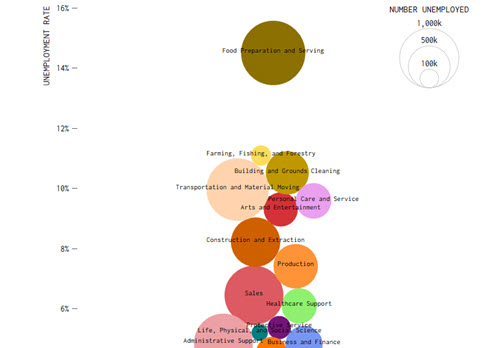
This quick animation from Flowing Data shows what a difference a year makes in unemployment across industries in the U.S.
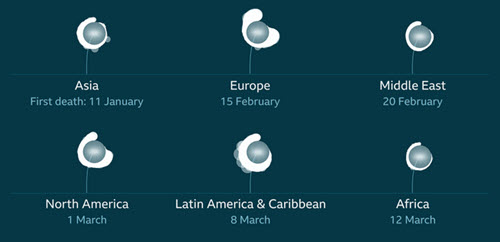
This article from the BBC experiments with a unique style of data visualization by showing coronavirus cases and deaths as a growing flower.
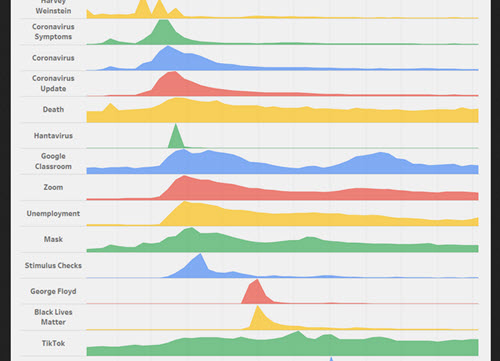
Data from Google was turned into this infographic showing the year in major search terms.