Data Stories: Physical Data Visualizations
Principles for creating physical data visualizations, a handheld 3-D printed example, and a visualization that takes up a whole wall.
- By Upside Staff
- December 9, 2020

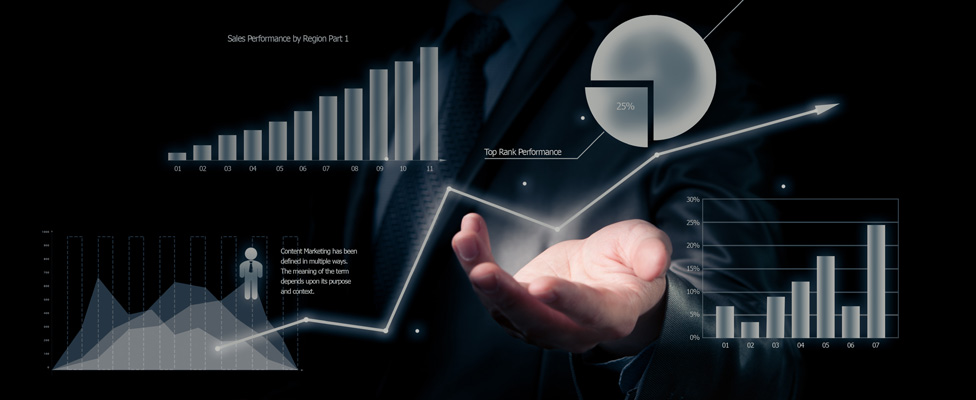
Can physical data visualizations help viewers interact with data? Check out these examples and explanations from a professor of journalism, art, and design.
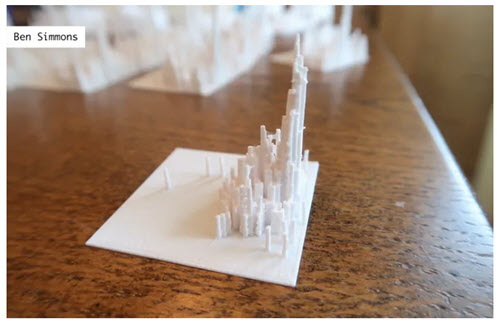
What is it like to hold your data? This article from Flowing Data describes the process of making sports data physical with a 3-D printer.

A Starbucks in Milan features a striking visual history of the company that combines a timeline carved into a brass wall with an augmented reality app.