Data Stories: Economic Trends Due to COVID-19
These recent data visualizations provide multiple perspectives on current economic indicators in the U.S. Also, a quick chart that shows why every parent you know is tired.
- By Upside Staff
- August 5, 2020

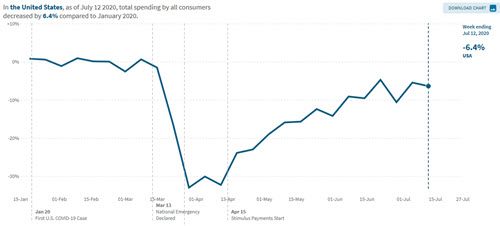
The Opportunity Insights Economic Tracker provides access to economic indicators such as employment rates, consumer spending, and job postings across counties, industries, and income groups. The interactive charts are close to real time thanks to anonymized data from private companies.

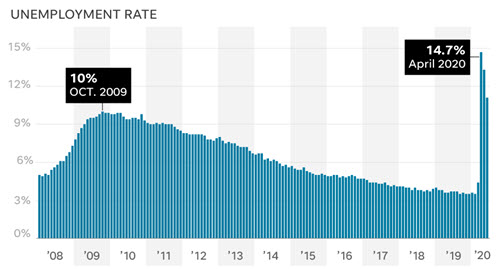
In this article, USA Today provides six charts to help viewers grasp the current economic impact of COVID-19.

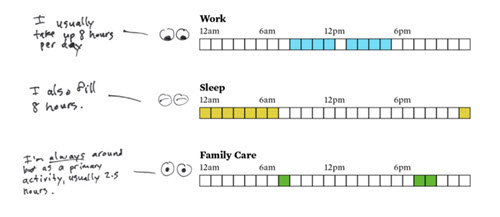
In an example of using data visualization in a humorous way to make a serious point, Nathan Yau of Flowing Data dramatizes the double- and triple-booked scheduling that many families are facing right now.