
Data Stories: Physical, Touchable Data Visualizations
These examples are just a few ways that data visualization can be used for more than simple bar graphs.
- By Upside Staff
- April 22, 2020
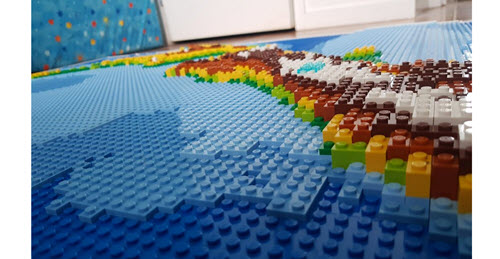
Data professional Alexander Waleczek was experimenting with Tableau and geospatial data when he decided to try a different medium: LEGO. He details the process of building an elevation map out of LEGO bricks on his website.
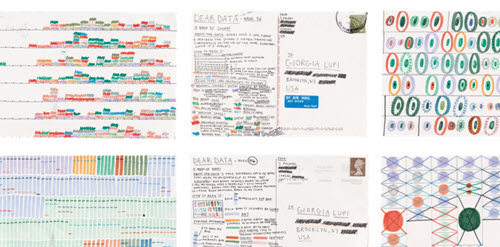
A series of actual postcards was the medium for whimsical data visualizations created by Stefanie Posavec and Giorgia Lupi.
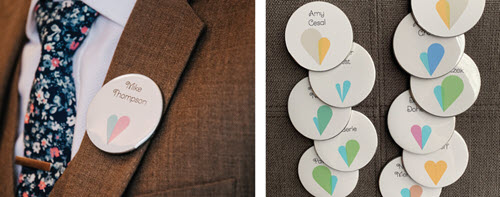
Data visualization professionals Amy Cesal and Zander Furnas decided to combine work and play by making buttons for the guests at their wedding—each with a small visualization that indicated the person’s relationship to the bride and groom.