
Data Stories: Sentiment, Language, and Visualizations
Learn how bad the word “bad” is, how to present data from a Likert scale, and how to run basic sentiment analysis.
- By Upside Staff
- January 29, 2020
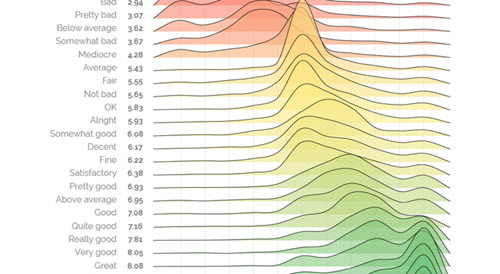
This study rated how positive and negative people actually find various positive and negative terms. If you are designing survey questions or describing the results of analysis, this might be good context to have.
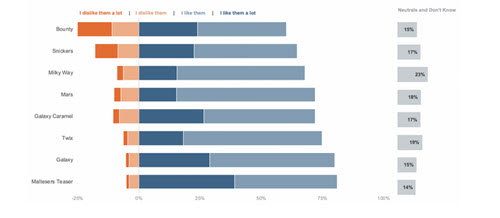
How should you portray opinions on a graph? This article explains multiple ways to illustrate responses recorded on a Likert scale.
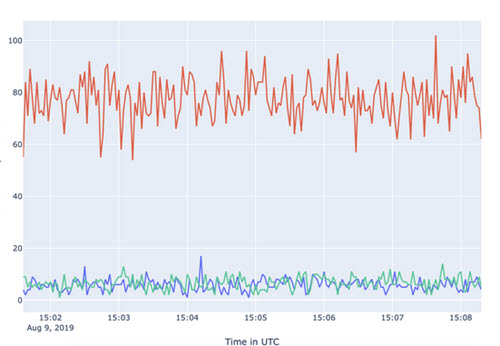
This tutorial on Medium will show you how to build a visualization based on sentiment analysis of Twitter data.