
Data Stories: Gender in Government, Drawing Districts, Types of Voting
Data visualizations are often used to present a large amount of information in a way that’s clear to the viewer. These visualizations explore the gender balance in the U.S. House of Representatives, how creating voting districts can swing elections, and the effect of ranked choice voting.
- By Upside Staff
- June 26, 2019
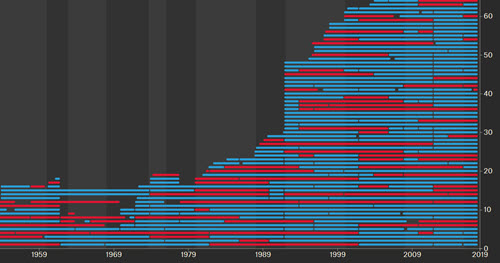
Last year, The Pudding created this in-depth interactive website about gender in the U.S. House of Representatives. (There’s also a version for the U.K.) Scroll through slowly to learn about the history and trends.
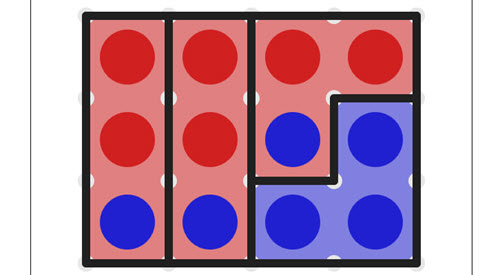
Play through this interactive game to learn the basics of how drawing districts affects election results as well as strategies for keeping elections fair.
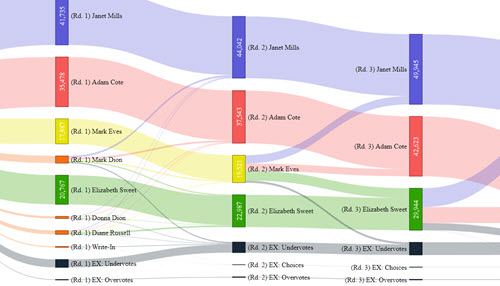
One strategy for election system reform is ranked choice voting. This chart shows how this method actually played out in Maine in 2018.