
Data Stories: Looking at Land Use, Population, Solar Potential
With these visualizations, explore land usage, population, and solar energy across the U.S.
- By Upside Staff
- August 15, 2018
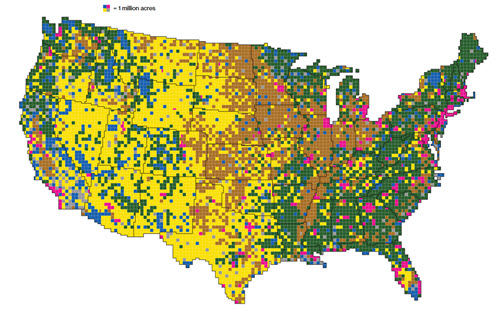
Bloomberg created this article full of interesting charts about land use in the U.S. Scroll down slowly to see all the details.
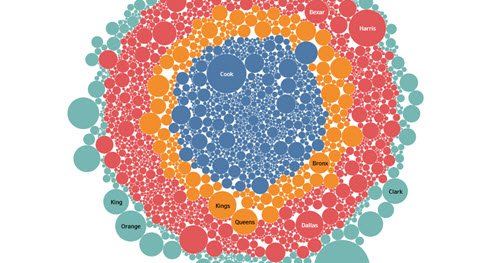
There are many examples of population laid out on a geographic map. This interactive graphic from Overflow Data instead shows a bubble map of U.S. counties categorized only by size and region.
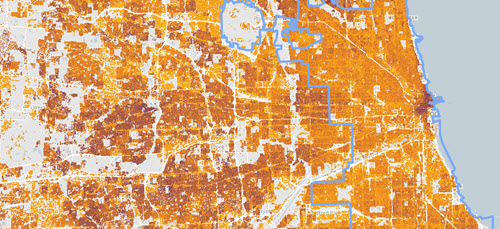
Project Sunroof from Google allows you to explore the potential for solar power installations for many locations across the U.S.