
Data Stories: Summer in the City
A big city such as New York is a fertile ground for interesting statistics. These charts track population change, taxi paths, and genetic diversity in city rats.
- By Upside Staff
- July 11, 2018
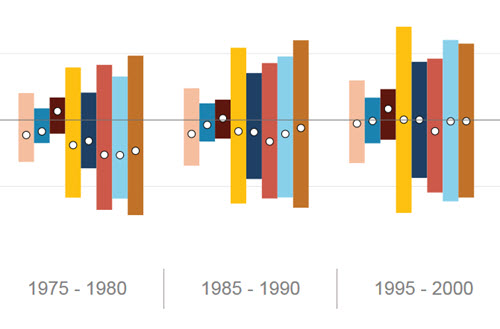
Thousands of people move into or out of New York City every year. These interactive charts break down population trends by demographics such as age, occupation, industry, and education.
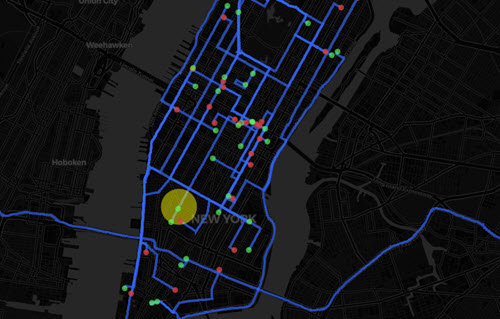
This fun technology project shows the path of a single taxi over a single day. Thirty random days of data were selected; you can choose a different taxi or speed up or slow down the map with the controls on the left.
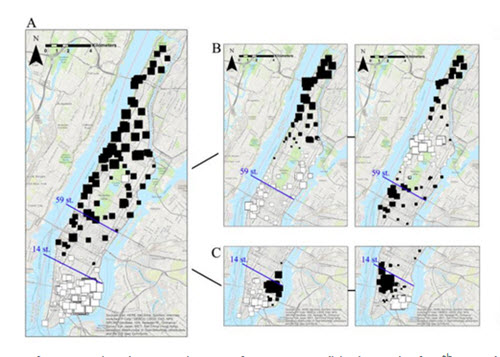
A recent study revealed that the rats of NYC live in genetically distinct “neighborhoods” and groups, many corresponding to human neighborhoods and boundaries.