
Data Stories: Simplification and Abstraction
How to simplify data visualizations and accompanying text, and how to use abstraction to explore algorithms.
- By Upside Staff
- March 14, 2018
Simple Is Good
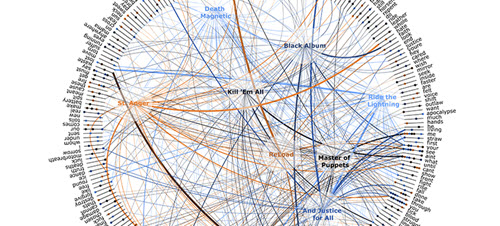
The Give Good UX blog shares examples of visualizations that are far too complex to read and straightforward guidelines for making your charts clear.
Words and Symbols

How much time do you spend considering the text labels or descriptions that accompany data visualizations? Christopher Walker of Polytrope explains how the right level of simplicity can help guide your audience through a complicated idea.
Abstract to Understand
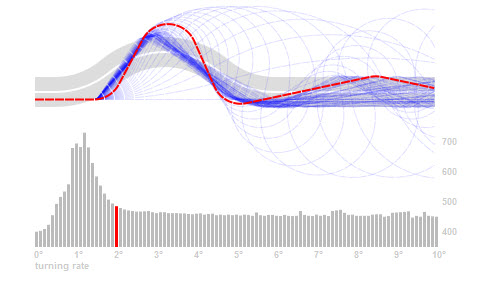
This in-depth interactive essay demonstrates one way to use visualizations to explore an algorithm at different levels of abstraction.