
Data Stories: Three Examples of Exploring Media with Tableau
These visualizations each use Tableau to present data about film or television, but each creator took a different approach.
- By Lindsay Stares
- January 10, 2018
The History of Film
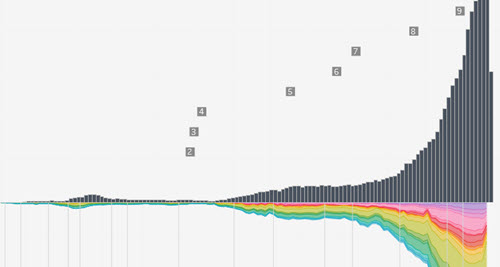
This visualization presents the whole of film history in one chart. It demonstrates overall growth and change, but the data scope is so broad that you might find it difficult to isolate many specific trends or insights.
One Studio Dominates
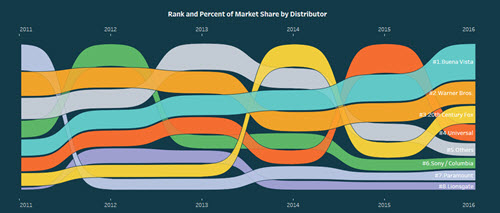
This visualization is an example of data storytelling. It uses multiple charts and narrative to explain how Disney came to lead the recent box office totals. Storytelling techniques like these are good for making a specific point and supporting it with data.
Browsing Old Episodes
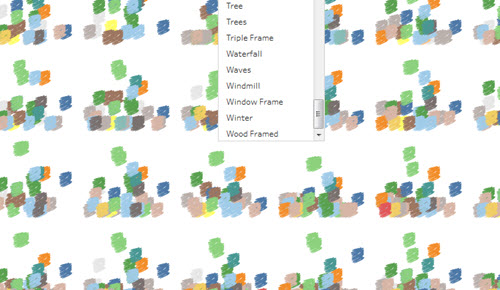
This user chose to emphasize interactivity. By quantifying the elements painted in each season and each episode of The Joy of Painting, this visualization allows users to locate and view episodes with a specific topic. This type of drilling down allows a visualization to double as an interface for exploring data.
About the Author
Lindsay Stares is a production editor at TDWI. You can contact her here.