
Data Stories: Analyzing Movies and TV
Visualizations show us the numbers behind acting’s gender gap, connections in the television world, and trends in the editing profession.
- By Lindsay Stares
- April 12, 2017
Movie Dialogue by Gender
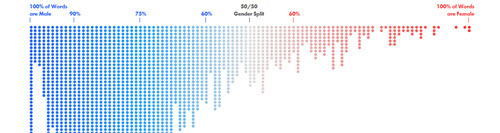
Hollywood has a gender gap, but how big is it? Instead of assuming that male characters dominate most films, this analysis proves it by taking 2,000 screenplays and showing the data through multiple interactive charts.
Television Is a Small World
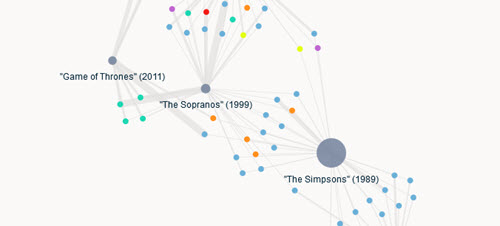
This interactive webtoy allows you to see how television shows are connected through the people who worked on them. It’s a fun distraction, but it’s also a simple example of how you can visually explore relationships in a data set.
Behind the Scenes
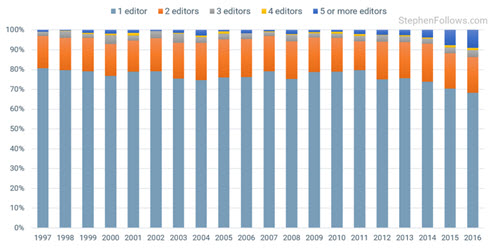
Writer and producer Stephen Follows also does research into data and statistics in film. In this article he uses charts to explore correlations and trends in the number of credited editors on a movie.
About the Author
Lindsay Stares is a production editor at TDWI. You can contact her here.