
Data Stories: All About Visualization Tools
Learn how to choose a modern data visualization tool, what tools were used to create infographics by hand, and what work is still being done by hand today.
- By Lindsay Stares
- March 29, 2017
Choosing the Right Tool for Your Data
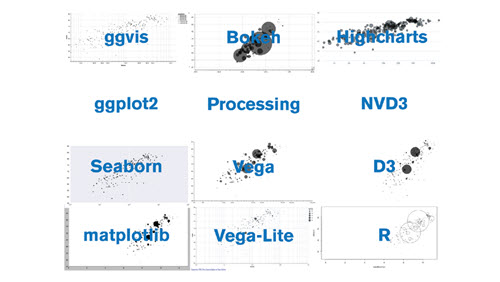
There are so many tools for data visualization today, how do you choose one? This designer tried using 24 different tools to create the same chart. She explains why your goal and mindset affect which tools will work best for you.
Old-School Tools

Before the ubiquity of digital visualization, infographics and charts were drawn by hand. Take a stroll through history with this post that explains the purpose of several tools that used to be commonplace.
The Line Between Data Visualization and Art
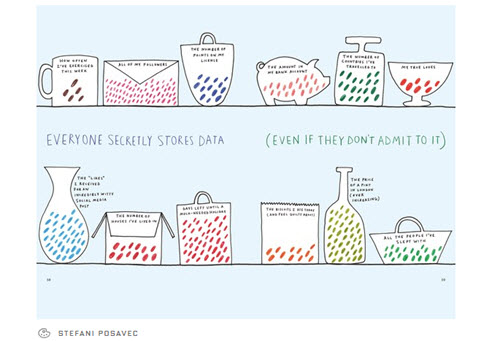
On the other hand, some artists are still experimenting with hand-drawn infographics. Wired recently presented a round-up of interesting work in this niche field.
About the Author
Lindsay Stares is a production editor at TDWI. You can contact her here.