
Data Stories: Salary Growth, Skills in Demand, and The Simpsons
Visualizations are used in these articles to determine which industries pay the highest analyst salaries, which skills are most in demand, and what Homer Simpson’s average salary would be.
- By Lindsay Stares
- November 2, 2016
Comparing Analyst Salaries
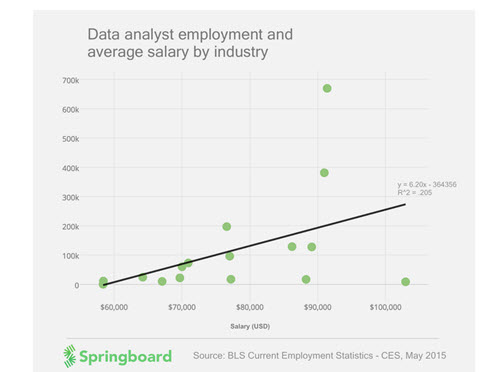
Online education provider Springboard crunched some numbers on data analyst salaries earlier this year in an attempt to determine which industries pay more for the same job. They present their findings with some straightforward, clean charts and an in-depth blog post about the research.
Skills in Demand
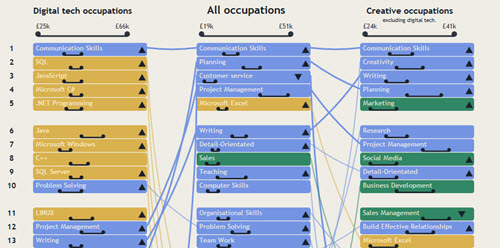
UK-based “innovation foundation” Nesta created this interesting chart that diagrams the most common skills they found in job advertisements. The columns show the differences between digital technology positions, other creative occupations, and all employment. The lines help you find the skills that overlap. Use the filters at the top to see which skills are associated with the highest pay or which are growing the fastest.
The Simpsons and Salary Growth
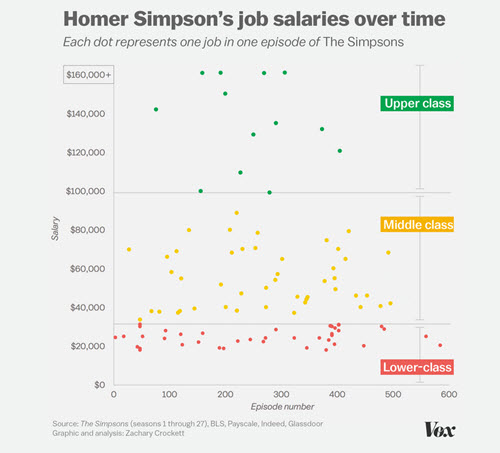
This video and article from Vox make the case with charts and data that Homer Simpson is the epitome of the modern middle class -- he’s had a lot of jobs but he isn’t really getting ahead. The research estimates and charts the salary for over 100 jobs held by the character over the 27 seasons that the show has been on the air.
About the Author
Lindsay Stares is a production editor at TDWI. You can contact her here.