
Data Stories: Exploring Halloween Costumes and Candy
It’s almost Halloween -- time to explore costume trends and candy consumption with the help of a little data!
- By Lindsay Stares
- October 26, 2016
How Unique Is Your Costume?
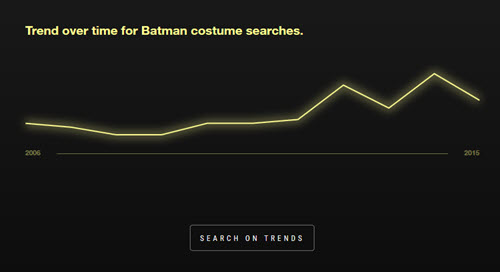
Last year Google compiled the 500 most popular Halloween costume searches into an interactive tool for trend exploration dubbed “Frightgeist.” You can explore the map to see the most searched-for costumes in a region, or type in a specific costume to see its overall search rank and status over time.
A Bit More Costume History
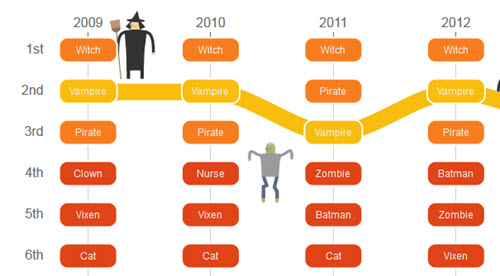
For a much simpler snapshot, check out this chart from NPR’s Planet Money. It shows the 13 most popular costumes from 2009 to 2013, according to the National Retail Federation. Hover over the chart to see how specific costumes rise or fall in popularity over time.
Using Census Data for Candy Predictions
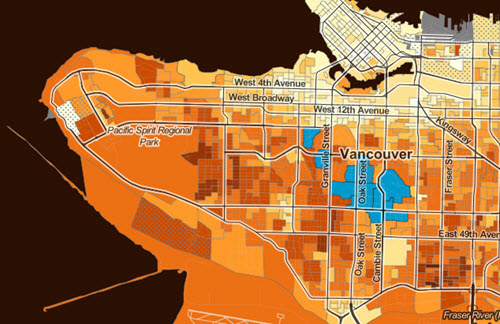
A team of Vancouver software developers put together a map that displays the number of children of trick-or-treating age across their city. This brief from the Toronto Sun has more information about the project (and a video about the economics of a candy no one likes).
It’s an interesting example of how you might use publicly available data (census data, in this case) to answer a specific question (how much candy is someone living on a particular block likely to hand out).
About the Author
Lindsay Stares is a production editor at TDWI. You can contact her here.