
Embedded Analytics: The Future of Business Intelligence
Traditional BI tools might be on their way out, because embedded analytics turns BI from a reactive activity into a proactive one.
- By Wayne Eckerson
- September 8, 2016
Editor's note: This is a summary of a report available at Eckerson Group, along with a companion report,Which Embedded Analytics Product is Right for You?
An Era of BI Tools
Business intelligence (BI) has long been associated with tools: business user tools for viewing and interacting with reports and dashboards and business analyst tools for querying databases and visualizing, analyzing, and modeling the results. During the past 25 years, software vendors have shipped hundreds, if not thousands, of BI tools that help businesspeople turn data into insights and action.
The era of BI tools, however, may soon disappear. More accurately, the time when organizations purchased BI licenses for every knowledge worker may be drawing to an end. Rather than distribute analytics tools to employees, organizations will increasingly embed analytics output -- reports, dashboards, insights, visualizations, and recommendations -- into business applications that businesspeople both inside and outside the organization rely on to do their jobs every day.
In short, the future of BI is embedded analytics. (See Figure 1.)
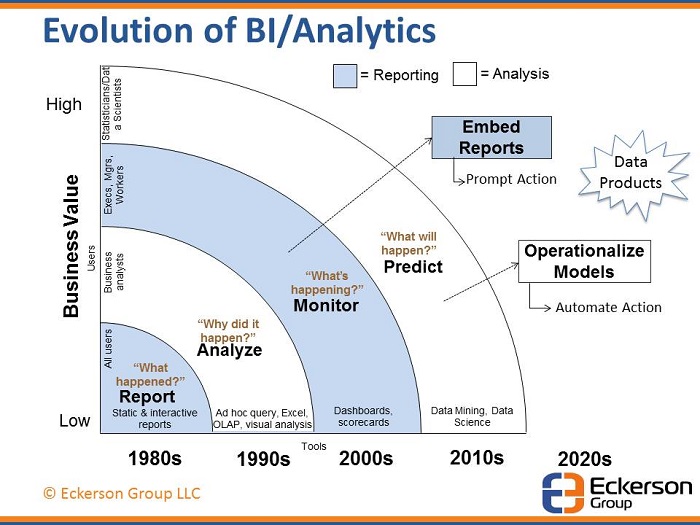 Figure 1. The evolution of BI -- and its future.
Closing the Last Mile of BI
With embedded analytics, business users no longer have to exit a business application to view results, analyze performance, and view recommended actions; they can do this inside the application itself. Organizations can not only embed reports and dashboards into applications and portals; they can also embed syndicated data (e.g., demographics) and the output of predictive models, turning customer-facing applications into powerful tools for reducing costs, growing revenues, and increasing customer satisfaction.
Critics of BI have said that by the time business users look at reports and dashboards, it's too late to take action and change outcomes. Embedded analytics addresses that challenge, turning BI from a reactive activity into a proactive one. It helps close the proverbial "last mile" of BI -- turning insights into actions that help an organization achieve its strategic goals and financial objectives.
Evolution of Embedded Analytics
The embedded analytics market is not new; it's been around as long as BI software. Of course, the way BI has been embedded into applications has changed immensely since the mid-1990s. (See Table 1.)
|
Decade
|
BI User Features
|
Data Sources
|
Platform
|
BI Software
|
Client Code
|
APIs
|
Developers
|
Pricing
|
|
1990s
|
Static Reports
|
RDBMS, files
|
Desktop
|
Desktop BI tools
|
Windows, Unix
|
Code-specific libraries
|
Independent software vendors (ISVs)
|
User-based
|
|
2000s
|
Interactive reports, OLAP, dashboards
|
OLAP and XML
|
Web
|
Web BI tools
|
ActiveX, JVM, Flash, Silverlight
|
SOAP, iFrames
|
ISVs and internal developers
|
Server-based
|
|
2010s
|
Self-service, predictive, and blended analytics
|
Cloud apps, big data, NoSQL, streams, search
|
Cloud
|
BI platforms
|
AngularJS, Ember.js jQuery, AJAX, etc.
|
REST, JavaScript
|
ISVs and internal developers
|
Value-based
|
Table 1. Evolution of embedded BI.
For instance, the functionality of embedded analytics has evolved from static reports in the 1990s to interactive reports and dashboards in the 2000s to self-service, predictive, and blended analytics today.
In addition, embedded BI tools can now access a much broader range of data than relational databases, which were the predominant data source in the 1990s. In the 2000s, BI tools could routinely query OLAP and XML sources, and today many support a bevy of cloud applications and big data sources.
Moreover, embedded analytics software moved from the desktop to the Web 15 years ago and now runs in the cloud, where organizations can rent the software on a monthly (or sometimes hourly) basis. Web- and cloud-enabled BI applications run on separate servers and thus share no code or libraries with host applications, making it easier to embed analytics into those applications.
APIs and Developers
APIs. The embedded analytics market revolves around application programming interfaces or APIs, which developers use to either customize or extend an analytics tool or call its functions from within a host application.
Many BI vendors today ship platforms, which come with a rich set of APIs and cloud-based deployment features that make them ideal for embedding into other applications. With traditional BI tools, what you see is what you get -- you must embed the entire tool, including the graphical user interface (GUI). Analytics platforms, on the other hand, are infinitely customizable and extensible and can be "beheaded." That is, customers can ditch the product's packaged GUI and write their own that exploits the analytics platform's core functionality.
APIs have evolved from client/server programming libraries (e.g., COM) to Web-based interfaces such as SOAP, iFrames, and client-side plug-ins, to modern standards such as JavaScript and REST. Many BI vendors supply JavaScript APIs that make it easy to create new charts and graphics, modify existing ones, and embed BI visualizations into other Web applications. In contrast, REST APIs are generally used to access back-end administrative functions, such as publishing, provisioning, scheduling, and user administration.
Developers. The community of developers has expanded from coders working at software vendors who used tools such as Microsoft Visual Basic and Visual Studio to embed static reports into commercial software products. Today, developers are found within information technology (IT) departments and application development shops in user organizations. In other words, embedded BI is becoming pervasive.
Although software vendors still comprise the lion's share of organizations implementing embedded BI, corporate developers are catching up. As executives recognize the value of their data assets, they now want to monetize them by developing data-rich applications for customers and suppliers. This typically involves embedding reports, dashboards, self-service analytics, and predictive models into tiers of outward-facing applications.
Brave New Market
Embedded analytics is not new, but the technology for integrating charts, reports, dashboards, and self-service tools has evolved considerably in the past 30 years. Formerly, only software vendors embedded analytics tools into applications, but now organizations in every industry are doing so.
Consequently, many BI vendors now target the embedded analytics market as a high-growth area and have made their products easier to embed and manipulate from within other applications.