
Understanding the Hype Curve
The hype curve goes a long way to explaining how a product goes from a theory to maturity.
- By Bill Inmon
- March 2, 2016
The other day I was at a conference and asked the audience who was familiar with the "hype" curve. Not one person raised their hand. That was shocking to me because I thought everyone in technology knew about the hype curve.
It is my understanding that the hype curve comes to us from the Gartner Group. If that is not the case and I am shortchanging someone, then my sincere apologies, but I have always heard of the hype curve as being an invention of the Gartner Group. Please let me know if I'm mistaken.
The hype curve addresses the changing perceptions and expectations of a technology as the technology matures. The hype curve is especially relevant to a technology in its early days.
It is normal and natural for a new technology to arrive in the marketplace with expectations. Vendors go on about the wonders and promises of their new technology. That is what vendors do. The reality of what new technology actually is and actually does is always something different from that that was promised by the vendor. There is always -- always -- a disparity between what the vendor promises and the reality of the capabilities of the technology. Because of this disparity, we have what is called the "hype" curve.
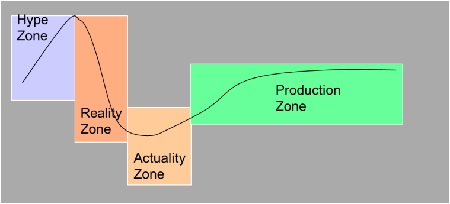
Figure 1. A simple hype curve.
Figure 1 shows that as a new technology is introduced to an organization, the expectations about the technology are very high and that expectations are raised daily. It is at this point that the vendor is making promises. There are no (or very few) use cases at this point to either prove or disprove the vendor's claims. The vendor is free to say pretty much anything he/she wants to at this early point in the life of the new technology.
As time passes, the expectations about the capabilities of the technology reach their peak. It is at the peak that customers start to engage with the technology. It is also at the peak that reality starts to enter the picture. As the product is installed and starts to be used, the expectations about the technology's capabilities fall into what is called the "trough of disillusionment." After a while, the users start to have a reasonable set of experiences with the product and the expectations about its capabilities begin to rise. That rise is based on the actual use of the technology and an observation of its actual (not hyped) capabilities. At this point, the end user is responsible for the elevation of the expectations of the technology, not the vendor.
Finally the expectations level off and reach what we can call a state of equilibrium.
This, then, is a very brief description of the Gartner hype curve. In one way or the other every technology goes through this predictable cycle.
To understand the cycle better, the cycle can be broken into different zones, which Figure 2 illustrates.
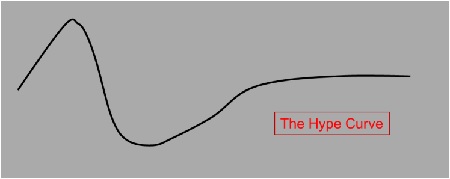
Figure 2. The four zones of a hype curve.
The first part of the hype curve can be called the "hype" zone. In this zone, the vendor is selling the power of the technology and is promising all sorts of things. It is in this zone that expectations are raised about the capabilities and uses of the new technology are going to be. Because the technology is new, the world has to take the vendor's word about the new technology.
In the reality zone, the technology is actually implemented and placed into production. At this point, the end user is in control of the technology and the end user forms opinions about the technology based on how the technology actually performs. At this point, user expectations of the technology diminish; the end user finds out about the technology from the technology itself, not from the vendor coaching the end user.
The bottom of the expectation curve is the trough of disillusionment. At the bottom of the trough of disillusionment, the end user starts to find out about what business value the new technology actually has. Step by step, the real business value of the technology becomes apparent. This zone can be called the actuality zone.
Finally, as the implementation of the technology becomes mature, the organization enters the production zone. The expectations of the technology are created solely by the organization, the technology, and the maturing and understanding of the day-to-day use of the technology. In addition, there are often economies of scale enjoyed here.
It is interesting to note that although there is one generic hype curve, the hype curve of different products varies considerably from one product to the next. Stated differently, no two hype curves are exactly the same.
Figure3 illustrates this phenomenon.
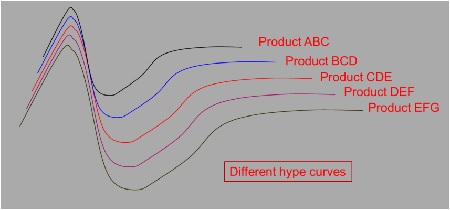
Figure 3. Hype cycles differ by product.
The steepness of the fall of expectations, the depth of the trough of disillusionment, and the rise of the actualization of the product vary wildly from one product to the next.
The hype curve goes a long way to explaining how a product goes from a theory to maturity. It is healthy for every computer professional to have at least a cursory introduction to the Gartner hype curve. If nothing else, the hype curve allows the computer professional to have a more mature perspective of what is happening in the industry.
About the Author
Bill Inmon has written 54 books published in 9 languages. Bill’s company -- Forest Rim Technology -- reads textual narrative and disambiguates the text and places the output in a standard data base. Once in the standard data base, the text can be analyzed using standard analytical tools such as Tableau, Qlikview, Concurrent Technologies, SAS, and many more analytical technologies. His latest book is Data Lake Architecture.