Business Intelligence 2006—Only the Beginning!
By Wayne Eckerson, Director of Research and Services, TDWI
The Evolution of BI

Business intelligence (BI) is supposed to be a mature industry. It “officially” started in the early 1990s with the emergence of Windows-based query and reporting tools offered by a few start-up vendors such as Business Objects, which now happens to be a $1 billion–plus Goliath in the industry. After 15 years or so—an eternity in software markets—you would expect everything to be sorted out, with a few major players dominating the landscape. Yet, that hasn’t happened.
Technology Innovations. I am continually amazed at the number of start-up companies in the BI space that offer new and innovative products. While there has been tremendous consolidation spearheaded by a few leading players, there is plenty of room for nimble start-ups to nibble around the edges of this fastmoving market. In fact, many start-ups are doing more than nibbling—they are gouging rather unseemly holes in the underbellies of the dominant contenders. They are doing this by leveraging:
- New Web application development techniques (such as asynchronous Javascript and XML [AJAX] and Flash technologies).
- In-memory processing that delivers faster processing and 64-bit chips that offer larger memory addresses to cache and process data on the fly.
- Appliances, Web services, and open source software that undermine current pricing structures and open the door to new ways of packaging and delivering content and BI capabilities.
- Google-style user interfaces to simplify access to both structured and unstructured data.
- Service-oriented architectures that create plug-and-play environments that can be quickly enhanced and deployed.
- Dashboard and scorecard applications that conform to the way users work rather than force users to conform to the way the tools work.
- Real-time processing via a bevy of data integration suites that integrate data adapters, ETL, enterprise system buses, federated queries, trickle feeds, and changed data capture.
- Search indexing, text mining, and natural language processing to ferret out the meaning of unstructured data and blend it with structured data.
- Advanced data visualization and analysis techniques that expose patterns and trends in numeric data that are otherwise difficult to detect.
- More flexible and better integrated “what-if’ modeling to support planning, forecasting, and simulation applications.
- Strategic management methodologies such as balanced scorecarding and business performance management.
- Extranet security and large-bandwidth Internet pipes that allow users to invert their data warehouses, and BI tools to make information and insights available to customers and suppliers on a massive scale.
Given this raft of new technologies and approaches, the BI industry still has plenty of room left to grow. The challenge for the dominant players is to innovate as quickly as the start-ups—or acquire these would-be competitors and their innovations—before they erode the established order and the premium pricing that accompanies it.
Five Major Dimensions
There are five major dimensions to BI: reporting, analysis, planning, monitoring, and advanced analytics. See Figure 1. (And many may argue there are additional dimensions.) Each of these dimensions is continuing to evolve and expand as organizations seek to deliver greater insights to more users in a timely way. The following sections describe the evolution of these dimensions and what new developments to expect in each during the next few years.
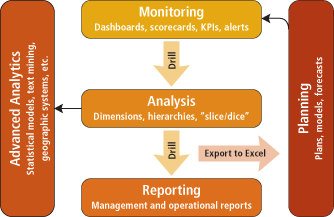
Figure 1. During the 1990s, BI tools evolved from reporting to analysis tools, which have recently been joined by planning and monitoring tools and techniques. Advanced analytics represents a substantial extension to the analysis layer through technologies that provide broader, deeper, and better analysis.
1. Reporting Dimension
Reporting is the oldest and most dominant of the BI dimensions. In the beginning, organizations simply delivered highly formatted reports to users. The reports were predefined, static, and paper-based. They reported on past activity and events, informing users of what had already happened in a relatively comprehensive way.
Linked and parameterized reports.
With the advent of the Web, reporting moved online and became more interactive and dynamic. Developers created linked reports that made it easier for users to navigate from one report to another or from a master view to a detailed view in the same or different reports. Developers also created parameterized reports that let users filter a predefined report and data set using pick lists or prompts. Elated by this newfound flexibility, many users now equate parameterized reporting with ad hoc querying, which it isn’t. (Unlike parameterized reports, ad hoc query tools place few constraints on what dimensions, metrics, and data users can view.)
Dynamic push-based reporting.
In the near future, Web-based reports will reach a new plateau of interactivity when developers leverage rich Internet application (RIA) techniques, such as AJAX and Flash technologies, to enhance users’ reporting experience. (Google was one of the first to popularize the use of AJAX as a development technique in its Google Earth and Google Maps Web applications.)
While RIA will infiltrate all types of Web-based BI applications, its greatest impact will be on extranet reporting. Instead of distributing 401(K) or payroll statements via PDF, as many financial services firms and providers do today using production reporting tools, companies will deliver secure RIA-based reports that let users interact with data in new and exciting ways. Using the bursting (i.e., broadcasting) capabilities of BI tools, companies will e-mail users customized views of their data—little sandboxes of data and BI functionality—that they can slice, dice, reformat, and revisualize however they want. TDWI calls the intersection of RIA and extranet reporting dynamic push-based reporting.
2. Analysis Dimension
In the early 1990s, reporting became passé. Users who bristled under the restrictions of inflexible and non-interactive report formats clamored for more dynamic analytical tools that would allow them to explore and analyze data in a relatively unfettered fashion. Consequently, vendors delivered ad hoc query and OLAP tools that let users “slice and dice” data to their hearts’ content. Subsequently, OLAP became really hot and the analysis of dimensional data emerged as the second major dimension of BI.
However, two things happened to cause a major crisis of faith among BI tools vendors whose flagship products were oriented towards analysis. First, it turned out that only a small minority of users really had much interest in using ad hoc query and OLAP tools. Most users found these tools much too hard to use or navigate without getting lost in the data or the tools. “Slice and dice” turned into “lost and frustrated” and created a host of BI shelfware.
Second, most BI vendors abandoned reporting, but then—almost too late— rediscovered that most users actually prefer viewing reports to exploring data in an unfettered manner. In the past several years, leading BI vendors have scrambled to cover their reporting flanks by developing or acquiring reporting tools. That’s why Business Objects acquired Crystal Software, Cognos developed ReportNet, and MicroStrategy and Microsoft both released new reporting products. With both reporting and analysis tools in hand, users would have a complete set of BI tools—a BI suite—or so vendors thought.
In-memory OLAP.
Today, a slew of startup vendors are offering next-generation OLAP technology. These tools avoid the classic problems associated with OLAP cube technology (cubes arrange data along predefined business dimensions for easy access and analysis): limited data sets, a minimal number of attributes, long precalculation times, client tools with limited graphical expressiveness, and headaches associated with managing burgeoning cube farms. Second-generation OLAP products use in-memory-based processing to circumvent performance and management problems, advanced visualization and dashboard displays to enrich user experience, and more integrated modeling (versus exporting to Excel) for planning and forecasting. The analysis dimension is one of the most active areas of BI innovation today.
3. Planning Dimension
By the late 1990s, BI vendors gradually discovered that most users were using analysis and reporting tools as glorified extract programs to dump data into Excel for planning, forecasting, and modeling, or into PowerPoint to create executive briefing books and presentations. These Excel users often issued runaway queries against the BI server so they could get a sufficiently large data set against which to do their analysis and modeling. This bogged down query performance for the few users who were trying to slice/dice data online, causing many to stop using the BI tools altogether. Subsequently, many BI vendors began to rally against the “improper” use of MS Office tools.
MS Office integration.
Today, rather than fight Excel and MS Office, many BI vendors have embraced them. They’ve supplemented their Excel export functions with SmartClient add-ins (i.e., downloadable and dynamically updated plug-ins to MS Office applications) that turn Excel, PowerPoint, and the rest of the MS Office suite into rich clients of BI application servers. Now, users can view and interact with predefined BI reports that are rendered in Excel (with varying degrees of fidelity) and dynamically refreshed when new data arrives. In essence, BI vendors have turned Excel into a full-fledged BI client.
Business performance management.
More importantly, leading BI vendors have embraced planning, forecasting, and modeling activities as an additional dimension of BI. More accurately, vendors see business performance management (BPM) as a new and powerful management discipline that uses BI technology as a key enabler and allows vendors to sell products and services at a more strategic level—essentially, they can sell solutions to businesspeople instead of tools to technologists. BPM brings planning, budgeting, and forecasting out of the Excel closet and wraps it in a management methodology that aligns users and processes to strategic objectives and goals and leverages BI capabilities to measure and monitor the resulting performance.
4. Monitoring Dimension
In the early part of this decade (2000–2005), many BI vendors recognized that overhauling the analysis dimension wasn't necessarily going to improve their ability to penetrate the larger market of casual users who found OLAP tools too demanding. Many BI vendors discovered that their strategy of touting the "self-service" capabilities of their analytical and reporting tools was backfiring. Most users, they realized, don't want to create ad hoc queries, build reports, and slice and dice data; they simply want the right data delivered to them at the right time, and only when there's something critical they need to examine. In other words, instead of self-service BI, users want customized delivery of information and insights.
Dashboards and scorecards.
So what does customized delivery look like? BI vendors discovered that most users want to monitor key metrics using a simple graphical display that also alerts them when performance falls below predefined thresholds. So vendors began delivering dashboard and scorecard interfaces on top of their analytical, reporting, and planning tools. Dashboards and scorecards let users compare performance to plan at a glance and send alerts about any deviations through user-defined channels of communication (e-mail, pager, cell phone, etc.). When an exception condition occurs, users then drill into the analytical tools to perform a root cause analysis (or pass the alert to their business analyst to do this) and then to reporting tools to examine detailed data and better determine what actions to take. Finally, they use planning tools to create new forecasts, readjust goals, and establish new monthly targets and thresholds.
BI platforms.
Today, leading BI vendors are working feverishly to seamlessly integrate the monitoring, analysis, reporting, and planning dimensions of BI. They are redesigning their products to run on a service-oriented architecture so that all tools share common services such as security, metadata, data access, rendering, etc. (See Figure 2.) These BI platforms transform distinct BI products into a suite of highly integrated applications running on a shared set of services within a single architecture. This will enable users to access information in any dimension of BI and then seamlessly move between applications (or layers) as their needs dictate.
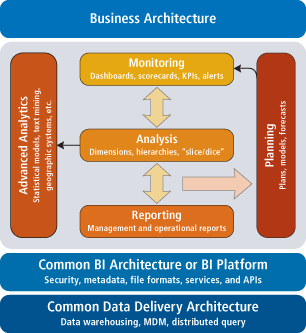
Figure 2. BI platforms transform once-separate BI tools into an integrated set of applications that are aligned with strategic objectives and run on a single BI architecture built on top of a robust data infrastructure.
5. Advanced Analytics Dimension
While BI vendors rush to offer a BI platform that provides integrated reporting, analysis, planning, and monitoring, user requirements keep moving ahead. There is now a groundswell of interest in exploiting new dimensions of BI, namely data mining, text mining, and advanced visualization. I group these under "advanced analytics." Many companies are now asking, "How can we deliver further value from our DW/BI investments?" and, "How can we query, analyze, and report on both structured and unstructured data?" Advanced analytics are the answer.
Data mining.
For years, a small number of companies (mainly in the financial services industry) developed statistical- and rules-based models to detect hidden patterns in large volumes of customer transactions. These "data mining applications"—fraud detection, cross-selling recommendation engines, dynamic pricing, Web traffic analysis and site design, promotions marketing—yield tremendous payback on initial investments and often spell the difference between profitability and disaster for many companies. Today, vendors are embedding data mining algorithms and rules-based engines in a host of packaged analytic applications to disseminate their benefits to a wider audience of business users without requiring them to be statistical rocket scientists. Vendors are also bolting advanced visualization technologies into data mining-based applications and OLAP tools to accelerate the analysis and interpretation of results.
Unstructured data analysis.
BI vendors are also looking to enter the vast untapped market for analyzing unstructured data, which includes text, documents, images, geospatial data, video, Web pages, and so on. Unstructured data constitutes 80 percent of all information within organizations. Vendors who figure out how to marry the distinct worlds of structured and unstructured data access and analysis will garner a lot of attention and business.
Today, there are two basic approaches for combining unstructured and structured data for analysis. One uses search technologies to index structured data, while the other uses data warehousing techniques to extract and load unstructured data into relational databases. The first technique indexes both structured and unstructured data so that both can be queried using keyword searches. The second loads both types of data into data warehouses, where they can be accessed using SQL-based query tools. Both approaches have advantages and disadvantages, and neither is ideal at this point.
Conclusion
It should be obvious by now that BI is a rich and ever-expanding field. I see no limits to the growth of this industry, because it serves the basic need of individuals and organizations to transform data and information into insight and knowledge to drive profitable business activity. Such tasks are quickly becoming the hallmarks of highly agile and competitive companies. Consequently, there will always be a market for new and innovative ways of delivering insight and information to decision makers. So, for those of you in the BI industry, buckle your seatbelts—the ride has only just begun!
Wayne W. Eckerson is TDWI's director of research and services. Eckerson has 17 years of experience in the IT industry, and he has covered data warehousing and business intelligence issues since 1994. He is the author of Performance Dashboards: Measuring, Monitoring, and Managing Your Business (John Wiley & Sons), published in October 2005. You can reach him at [email protected].
Next
Previous
Back to Table of Contents