By using tdwi.org website you agree to our use of cookies as described in our cookie policy. Learn More

TDWI Upside - Where Data Means Business

Data Stories: Pie Charts, Snowflakes, and Icebergs

Looking for some fun visual uses of data? Check out pie chart names, generate snowflakes, and play with virtual icebergs.


A Taxonomy of Circles and Angles

sample of data visualization, linked to full visualization on Twitter

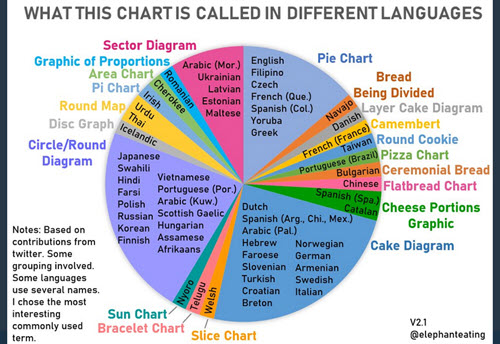
This twitter thread follows one professor’s playful attempt to collect terms for a pie chart in as many languages as possible.


Virtual Ice Crystals

sample of data visualization, linked to full visualization at vivariums.com 

This fun simulator grows snowflakes based on a set of variables input by the user.


Gravity and Buoyancy

sample of data visualization, linked to full visualization at engaging-data.com 

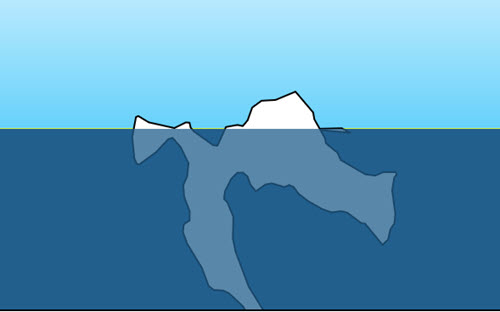
Draw any shape and this tool will show how it would float as an iceberg.

TDWI Membership

Accelerate Your Projects,
and Your Career

TDWI Members have access to exclusive research reports, publications, communities and training.

Individual, Student, and Team memberships available.