
Data Stories: Weed Taxes, Opioid Dangers, Lethal Doses
These data visualizations explore the impact of legalized marijuana, recent opioid overdose statistics, and the danger (or safety) of other substances.
- By Upside Staff
- May 12, 2021
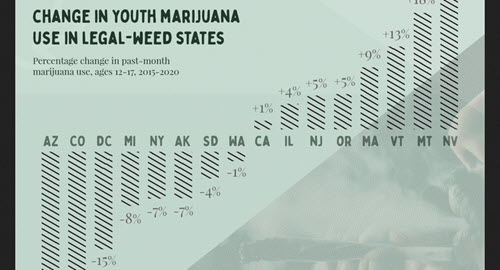
In states with legal marijuana, tax revenue and adult usage have risen some, but usage by teens varies widely according to these charts from US Drug Test Centers.
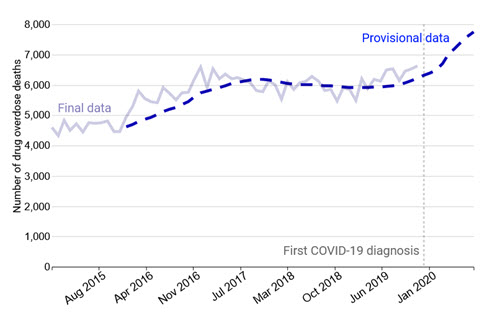
Preliminary data from the CDC indicates a jump in opioid deaths during the COVID-19 crisis, as illustrated in charts in this article from the data journalism blog Data, et cetera.
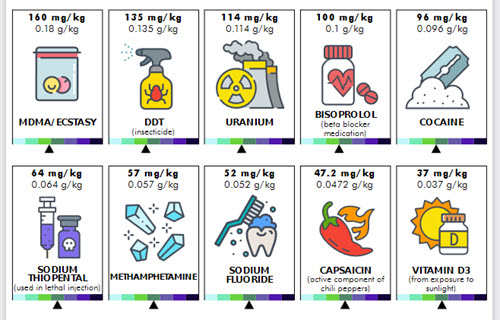
Any substance can be toxic if you consume enough of it. This infographic from CEUFast (a provider of continuing education in healthcare) shows the median lethal dose for 55 different items.