Data Stories: Visualizations and Statistics about Women Around the World
These data visualizations explore gender-based disparities in legal protection, research opportunities, and journalism.
- By Upside Staff
- March 24, 2021

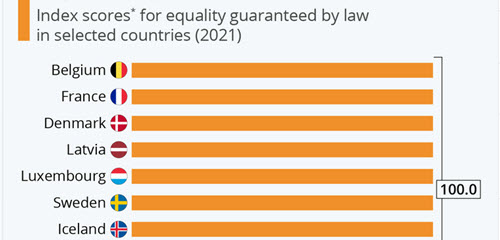
This short chart from Statista illustrates selected findings from the report Women, Business and the Law 2021, by the World Bank. The full report includes a huge amount of additional detail and numerous charts.

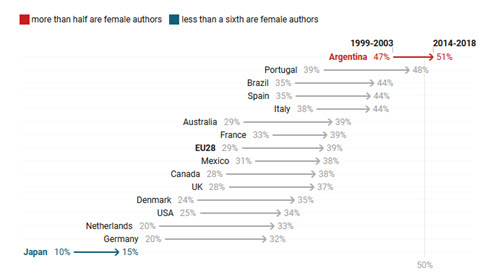
This blog post from DataWrapper explores statistics about the slowly changing number of men and women in various scientific fields.

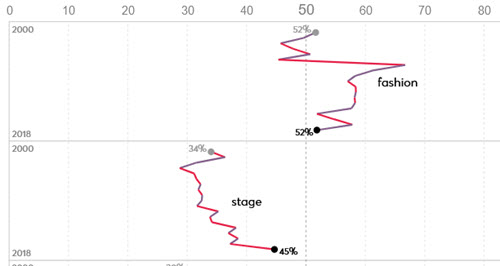
U.K. charity Nesta used big data, text analytics, and machine learning techniques to study trends in how much men and women are covered in reporting about creative industries.