Data Stories: Charting 2020
Reviewing the year by looking at the charts and graphs that illustrated it.
- By Upside Staff
- January 6, 2021

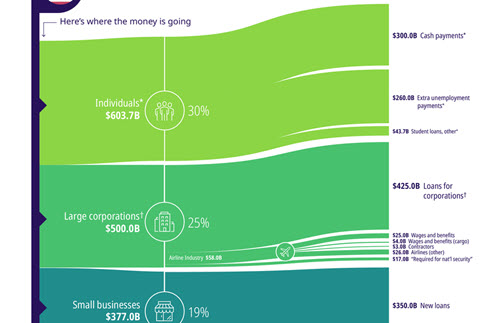
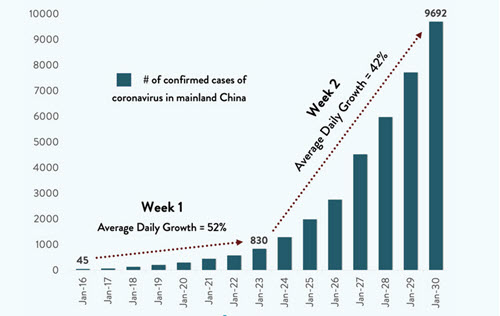
Visual Capitalist collected visualizations from the biggest news stories of 2020—both from that site and others.

The relatively new data visualization site Chartr also pulled together their charts that best summarized the roller-coaster of 2020.

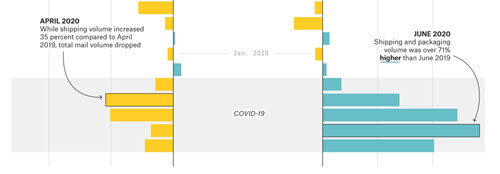
FiveThirtyEight didn’t create a timeline, but instead presented 40 of their charts from last year that were the most important, impressive, or just fun and weird.