
Data Stories: Charts Depicting Air Quality and Particles
Using data visualizations to understand the spread of wildfire smoke, how energy production affects air pollution, and the size of viruses and other particles.
- By Upside Staff
- October 21, 2020
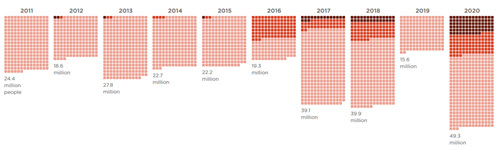
Many people were (and are) affected by recent wildfires in the U.S. NPR provides a few charts to give context to the scope.
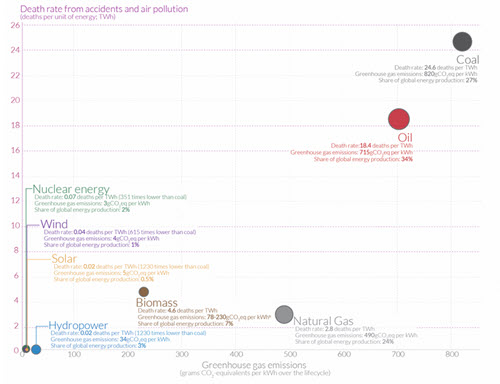
This article from Our World in Data compares the safety of various methods of energy production.

Between smoky air and the coronavirus, tiny particles have been especially dangerous this year. This infographic from Visual Capitalist shows the relative size of tiny viruses.