
Data Stories: Perceiving Time, Working at Home, Financial Trends
These visualizations show how our perception of time can change, who has been able to work remotely, and the financial impact of the pandemic in Canada.
- By Upside Staff
- July 29, 2020

This article from Reuters includes interactive experiments to demonstrate how your time perception can be affected by context.
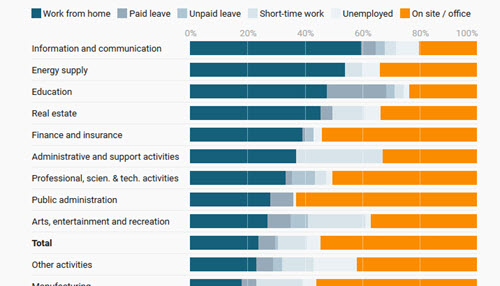
These charts from DataWrapper show which sectors have been more or less able to work remotely in Germany during the ongoing pandemic.
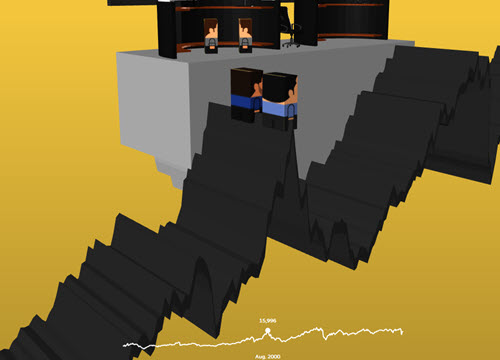
Use your arrow keys to step through these animated charts about the pandemic’s impact on major financial indicators (employment rate, stock market, oil prices, real estate sales, and travelers) in Canada. The interactive explanations include a great deal of context with historical rises and falls.