Data Stories: Depicting What’s Hard to See
Unique visualization techniques are being used to help people understand the scale of wealth, plastic pollution, and the speed of light.
- By Upside Staff
- March 11, 2020
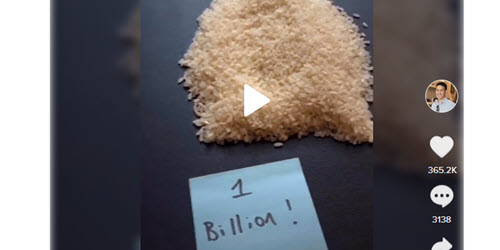
A viral video recently used grains of rice to convey to viewers the difference between one million dollars and one billion dollars. Using tangible everyday objects to represent data can be a great way to communicate abstract numbers when the scale is hard to picture.

To draw attention to the problem of plastic pollution, Reuters released a series of pictures that show how much microplastic the average person might be consuming.
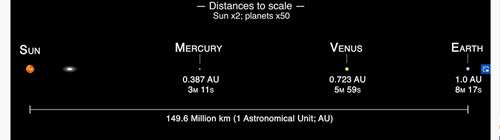
Planetary scientist Dr. James O'Donoghue creates videos that explore astronomical ideas in a way that’s easy to understand. This video demonstrates the speed of light to scale.