
Data Stories: Visualizing the Tech Industry and a Look at How It’s Done
A pair of visualizations of the tech industry and a deep-dive into how one visualization of global economics was created.
- By Upside Staff
- August 28, 2019
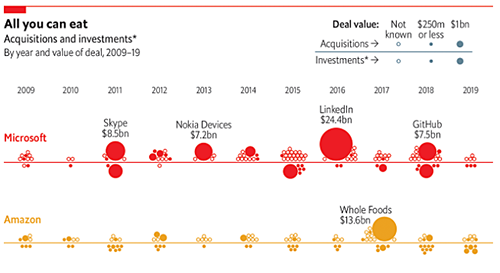
The Economist’s view on mergers and acquisitions activity among the Big 5 tech giants since 2009.
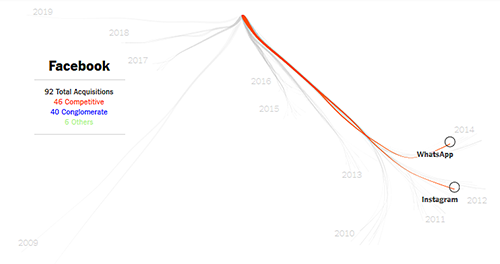
The New York Times also looks at mergers and acquisitions among the Big 5. Could it be time for regulators to look harder at breaking them up?
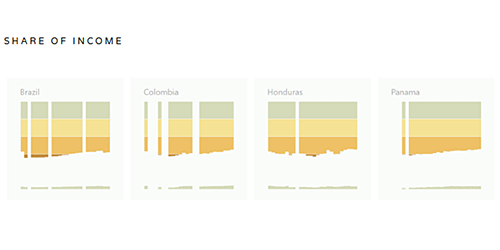
Erica Bugden and Francis Gagnon take us on a deep dive into their entry to the United Nations Development Program’s 2019 Data Visualization Challenge.