
Data Stories: Fireworks Injuries and Hazards
In the U.S., it’s time for the annual spike in fireworks-related injuries. Learn more in these three data visualizations.
- By Upside Staff
- July 3, 2019
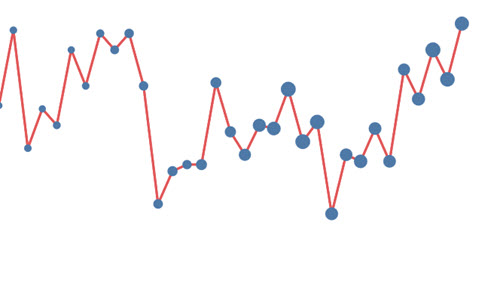
This Tableau chart from Overflow Data shows how many people are injured by fireworks in the U.S. each year and how many fireworks are consumed overall. Although the number of injuries has stayed within a certain range, the amount of fireworks used has risen, so the overall rate of injury has dropped sharply since the 70s.
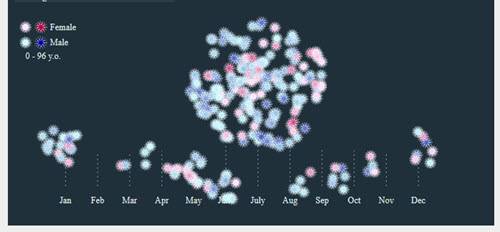
This article from STAT, a health and science media company, features a series of charts exploring fireworks injuries from various perspectives.
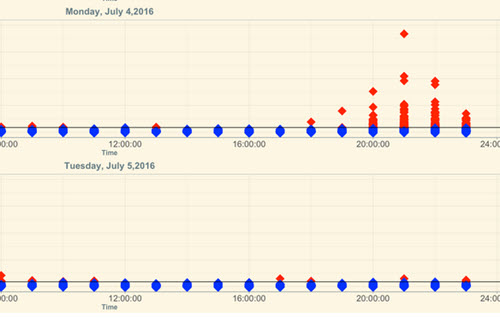
The use of fireworks on July 4 causes a measurable increase in air pollution in the U.S., as shown in these charts.