
Data Stories: America’s Pastime in Data
There are many ways to look at sports data. These visualizations chart the shapes of baseball fields, current season predictions, and the way pitch velocity has changed over time.
- By Upside Staff
- May 29, 2019
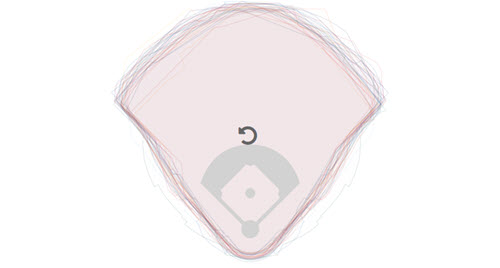
Baseball outfields each have a distinctive shape. This article uses animated maps and charts to define broad types of ballparks.
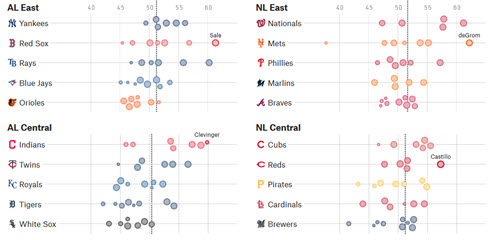
The statistics specialists at Fivethirtyeight are updating their predictions throughout the 2019 MLB season. Check out overall standings, individual game predictions, and pitcher rankings. Filter by team to see even more detail.
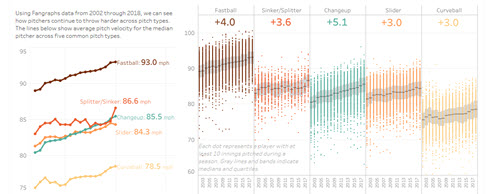
Like many sports, baseball is continuing to evolve. This Tableau workbook shows how pitch speed has increased over the last 16 years.