
Data Stories: Data Visualizations for Social Good
How data professionals support the UN Development Group, collect information for suicide prevention, and empower small nonprofits.
- By Upside Staff
- November 7, 2018
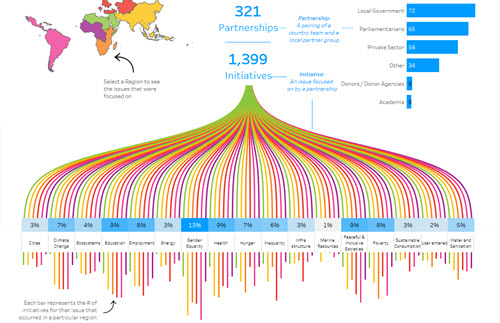
The organization Viz for Social Good connects data visualization professionals with mission-driven work that needs data support. This article profiles a project supporting the United Nations Development Group.
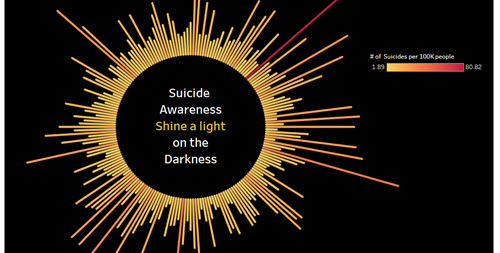
This Tableau visualization shows the rate of suicide around the world. Hovering over a country provides more information and a local hotline when available; the author is asking global viewers to contribute more information.
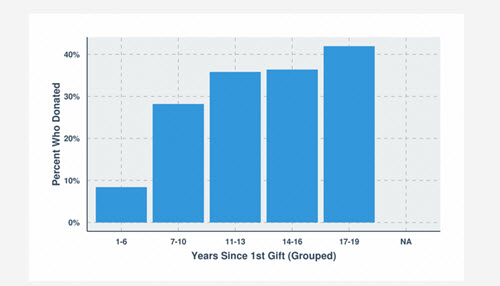
Even small amounts of data can make a big difference. This case study demonstrates how a small nonprofit was able to increase their fundraising after visualizing their data.