
Data Stories: Individuals Investigate with Data Visualization
Dog walking, pizza eating, and apartment hunting -- the data enthusiasts of the Internet can turn anything into a fun data visualization.
- By Upside Staff
- August 29, 2018
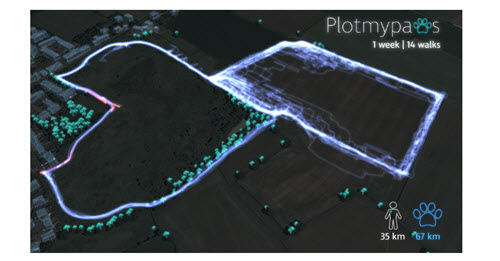
Craig Taylor is a data visualization professional, but his experiments with tracking and plotting the movement of his dog Bryn were done in his spare time. What else could you learn from tracking this type of movement?
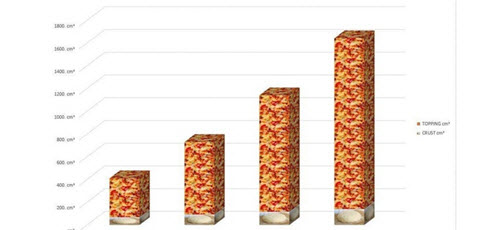
This simple chart, found on Reddit, demonstrates the value of different pizza diameters. In a comment, the creator describes the everyday curiosity that prompted his investigation.
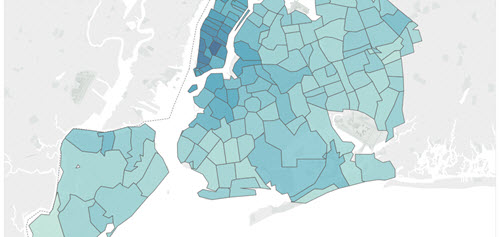
Frustrated with looking for a new place to live? So was self-described data enthusiast Erik Webb. In a blog post, he explains how he obtained and plotted NYC apartment data by ZIP code and number of bedrooms.