
Data Stories: Snow Melting, Closing School, and Tracking Snowfall
Is it cold where you are? These charts explore salt’s effect on ice, trends in snow-related school closures, and tracking snow across the U.S.
- By Lindsay Stares
- January 17, 2018
Will Salt Clear Your Driveway?

This article from a Detroit news channel explains why salt doesn’t work to melt ice and snow at very low temperatures.
Is School Closed?
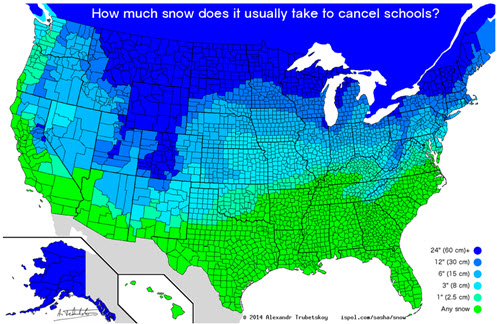
This simple chart from a statistics student effectively shows how different parts of the U.S. tend to react to different levels of snowfall.
Snow from Coast to Coast

This complex interactive map allows you to explore snow conditions throughout the U.S. going back over a decade. This visualization includes a huge volume of possible information; however, it’s not as user-friendly as some modern interactive charts. You need to select “Redraw Map” in order to make the image reflect your changes in the sidebar.
About the Author
Lindsay Stares is a production editor at TDWI. You can contact her here.