
Data Stories: Summer Jobs, Incomes, and Other Trends for Young Americans
These charts reveal trends in teenage employment, changes in income by generation, and how millennials shop.
- By Lindsay Stares
- July 5, 2017
Are Summer Jobs Disappearing?
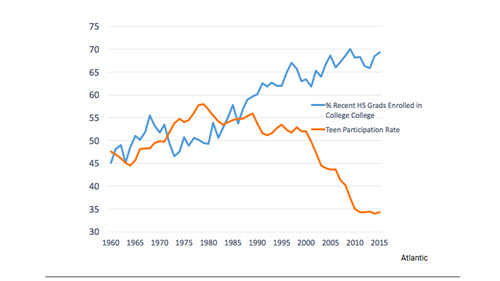
Why do fewer teenagers in the U.S. have summer jobs these days? The Atlantic presents several reasons and charts connected trends in this recent article.
Income by Age and Education
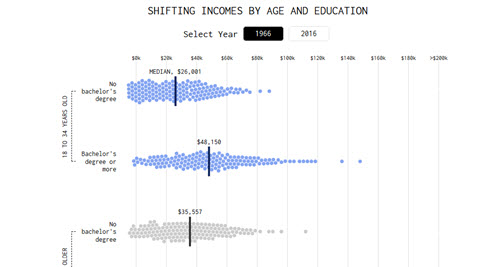
Flowing Data provides this interactive visualization that demonstrates a few trends in income, some subtle, some less so. The main question is whether it’s true that a person 18 to 34 years old today makes (on average) less money than a person the same age 50 years ago.
Millennial Habits for Buying and Living
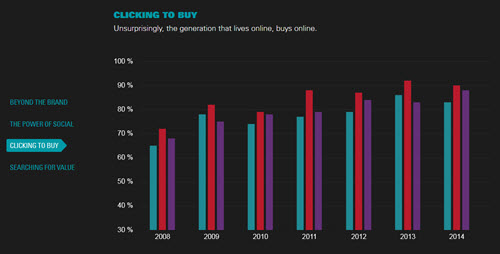
This infographic from Goldman Sachs is both animated and interactive, and that alone makes it a fascinating example of data storytelling. Happily, the story it tells is also interesting, as it explores millennials’ purchasing trends.
About the Author
Lindsay Stares is a production editor at TDWI. You can contact her here.