Data Stories: New Year, New Uses for Your Data
How to analyze your Web traffic for new trends, collect data in interesting ways, and create a new product out of data.
- By Lindsay Stares
- January 4, 2017
Web Traffic Reveals Software Trends

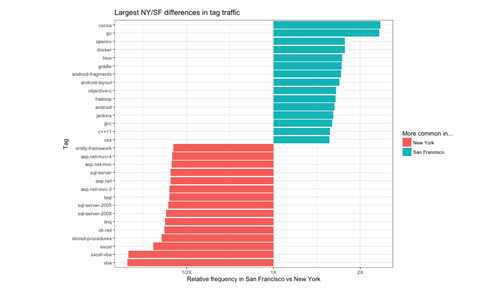
Stack Overflow, the online community for programmers, broke down their Web traffic by location in this series of graphs. The graphs reveal variations in which content is visited by programmers in different cities, and the accompanying commentary proposes some interesting takeaways. For example, Microsoft products are more commonly viewed in the financial hubs of New York and London.
What insights could you gain by charting your Web traffic against various demographics?
Collecting Data by Making It Interesting

Do you conduct surveys or ask your customers or clients for feedback? Graphics and interactive quizzes might give you a higher rate of return.
For an example, this project from MIT is collecting data from Web users to expand research into the ethics of autonomous machines. You are presented with a series of somewhat macabre situations in which a self-driving car suffers a brake failure and will either hit a pedestrian or several pedestrians or crash into a barrier, and in each case you select what you think is the better outcome. After completing a small number of scenarios, the system tells you how your decisions compare to the statistics collected by the project as a whole.
Beautiful Data as a Product

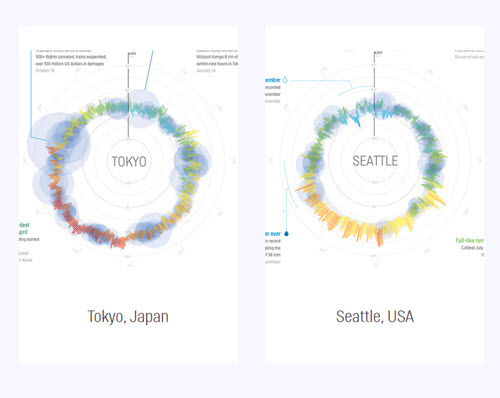
Raureif is the user interface consultancy behind an iPhone app that provides weather forecasts as an infographic. It also sells low-tech infographic posters, including this one about global weather. A year’s worth of weather is represented in a series of minimalist radial graphs.
Could data that you collect be repurposed for a new audience?
About the Author
Lindsay Stares is a production editor at TDWI. You can contact her here.