Data Stories: Exploring Everyday Life
These three interactive visualizations allow you to make your own discoveries about people’s relationship with food, the impact of where we live, and baby-naming trends.
- By Lindsay Stares
- September 21, 2016
Explore Moments with Food and Family

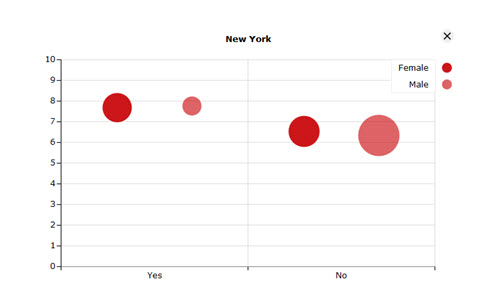
IKEA (yes, the Swedish furniture store) has provided the means to explore a unique data set about people’s relationship with food. The data includes over 11,000 survey respondents from 11 cities around the world. Select an activity to begin and then choose whether to narrow by location.
Use the simple menus to construct complex questions; above I’ve charted whether women or men in New York City are more likely to look for recipes online, correlated with how many respondents enjoy cooking. (More women look up recipes online, and unsurprisingly, both men and women who look up recipes enjoy cooking more.) What will you find?
Public Transit and Employment Mapped Together

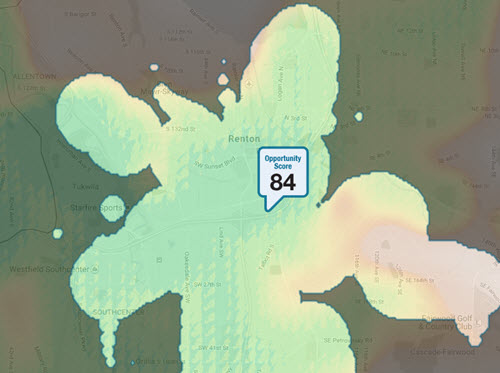
Real estate company RedFin launched an interactive project this summer called Opportunity Score that maps how many well-paying jobs you can reach from any point via mass transit. The tool is available for many U.S. cities. It assigns a score based on how accessible jobs are and provides a snapshot of the major local industries providing those jobs.
Read more about the project on the RedFin blog.
Baby Name Trends

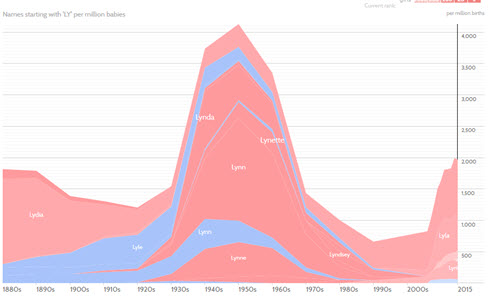
Was your name part of a trend? You can use this fun tool from Baby Name Wizard to search name popularity in the United States since the 1880s. Start typing and all names beginning with those letters will display, allowing you to see how similar names trend together.
Also look for names that peak, diminish, and then return to a peak 50 or 60 years later when new babies are named after their grandparents.
About the Author
Lindsay Stares is a production editor at TDWI. You can contact her here.