Data Stories: Follow the Presidential Race
Politics is dominated by data these days: polls, demographics, and trends abound. In these articles, learn how analysts use various analytics and statistics to project potential outcomes.
- By Lindsay Stares
- August 3, 2016
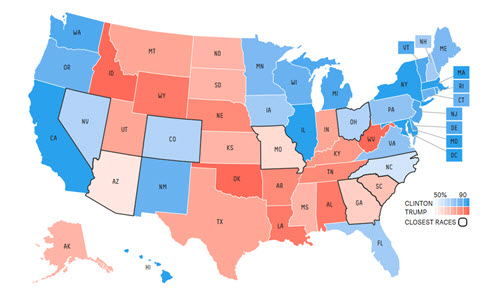
FiveThirtyEight Blends Weighted Polls with Other Data

Analyst Nate Silver first made the news by using statistics and analytics to forecast the 2008 election, so his site, FiveThirtyEight.com, is under pressure to impress with its models for 2016. This interactive tool allows you to drill down into specific states or explore alternate scenarios based on different data sets.
The methodology is explained in depth on the blog.
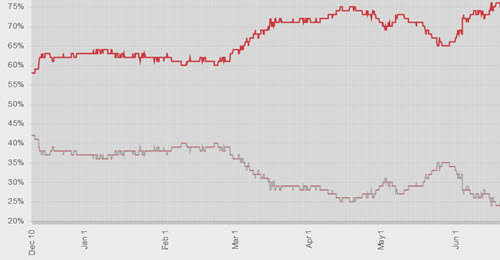
PredictWise Includes Market Data

Economist David Rothschild presents his analysis of political outcomes and other events on PredictWise.com. This prediction includes not only polling data but also prediction market data and bookie data. Similar to the FiveThirtyEight forecast, the PredictWise forecast is continually updated as new data comes in.
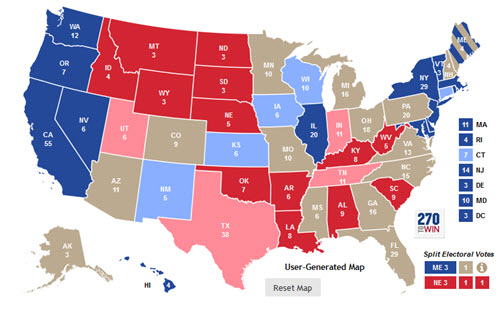
Create Your Own Prediction Map

The site 207toWin.com tracks and maps polls, pundits’ opinions, and historical election results, but many of their maps can also be altered by users. Click on any state to choose which party wins those electoral votes and you’ll see how the change affects the overall map and each party’s possible road to victory. If you come up with a map you like, you can even share it.
About the Author
Lindsay Stares is a production editor at TDWI. You can contact her here.