Data Stories: Politics and Social Media
See how the volume of buzz on Twitter reflected the presidential primaries, how politicians use social platforms to connect with voters, and how researchers have mapped social media conversations to visualize partisan groups.
- By Lindsay Stares
- July 6, 2016
Volume of Presidential Twitter Buzz

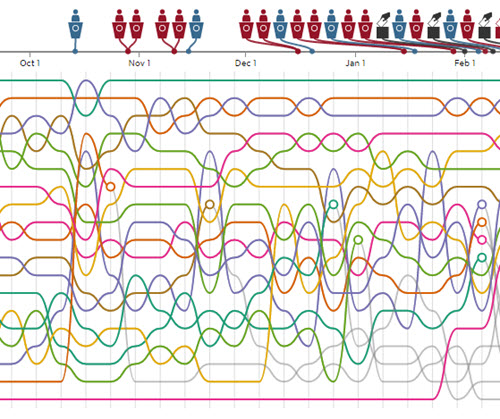
Social media sites are a popular venue for political discussions. This year, Twitter charted the volume of mentions for each 2016 presidential candidate from September 2015 to May 2016.
Debates, primaries, and caucuses are noted on the timeline. You can highlight a particular candidate to see their path or click “play” to watch how the social conversation changed over time. (I recommend using Google Chrome for the interactive functions.)
Politicians All Use Social Media

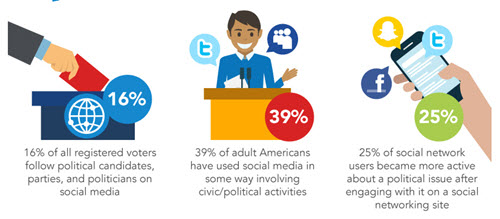
This interesting infographic from the University of Southern California shows how ubiquitous social media has become for politicians. It is a good example of providing statistics in a visually engaging way. It includes some recent history of U.S. politicians’ social media use as well as information about the social presence of global political and religious leaders.
The Structure of Political Conversation

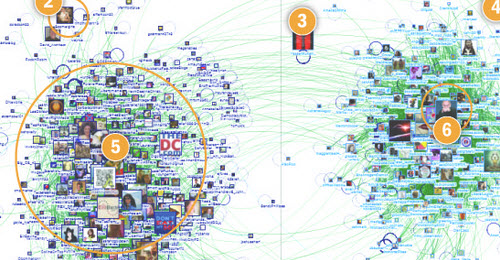
It is a truism that different political groups don’t talk to each other today. Pew Research Group actually analyzed and charted this phenomenon on Twitter.
This in-depth article from 2014 explains the different conversation and crowd structures the Pew researchers found. It also includes information about how the maps were created and invites readers to explore the tool and the data sets used.
About the Author
Lindsay Stares is a production editor at TDWI. You can contact her here.