Data Quality: Relevance versus Reliability
When evaluating variable data for a given business intelligence objective, we may observe that the relevant variables are not reliable or that the reliable ones are not relevant. Here's how to address this situation.
By David Nettleton, Contract Researcher, Web Research Group, Pompeu Fabra University
A data mart should be designed with specific business objectives in mind, and we should plan to obtain the data we need for those objectives. For example, consider that we want to predict if a customer will buy product A based on a set of variables we think are related. The initial list could include whether the customer purchased product B, disposable income, homeownership, marital status, how long they've been a customer, ZIP code, and cell phone use.
First, we evaluate the reliability of the variables. We do this by checking, for each variable, what percentage of the data records have a value. Depending on our type of business, we may have more opportunities to obtain data about our customers. Banks and insurance companies tend to have a large amount of demographic data, which the customer has to supply in order to contract for a financial product. Other businesses, such as retail, rely on customer loyalty cards to obtain additional customer demographic information. In our example, the information about the purchase of a product B could be readily available, as well as the time as customer. The ZIP code, marital status, and homeowner data may also be easily obtainable based on product/service type. However, the disposable income and cell-phone usage variables may be incomplete because we don't currently collect that information or the customer is not willing to supply it.
Another aspect of reliability is what is recorded in the data variable. The ZIP code may be entered in 100 percent of the records but in 50 percent of the records it doesn't comply with the correct format. Or the disposable income may be entered in 80 percent of the records but 40 percent of the time it doesn't tie in with the other socio-economic indicators we have about the customer. This may be because the customer tends to make up a value instead of entering the true one, because of an error during data entry, or created by an automated data process. For example, we could have cases of VIP clients who are also insolvent.
If the data is not available or it's not reliable, we may choose one of several options. We may decide to launch a campaign to obtain key missing data, via customer surveys, online questionnaires, or by deriving it from other currently available data. Second, we may decide to change the business objective so that the required variables are ones we already have. The choice of course will probably be a cost/benefit one. How much will it cost us to obtain the data we need? How much benefit will applying the business objective give us? Ideally, we should be able to quantify the reliability by assigning a number to each variable. For example, we could use a scale of 0 (totally unreliable) to 1 (totally reliable).
Once the reliability has been assigned for each variable, we can evaluate the relevance with respect to the business objective. We can do this by several approaches. We could use a totally manual approach in which a business expert assigns a value between 0 and 1 to each variable. For example, in the case of the business objective "customer buys product A," a marketing expert may assign "customer bought product B" with relevance 0.9 and "cell-phone usage" with 0.2.
A second approach for assigning the relevance of a variable with respect to a business objective would be to use statistical techniques. In the case of the numerical variables, we could correlate each variable with the output. We note that the example output variable is binary (customer bought product B or not), which is a special type of categorical data. However, for statistical purposes, we often consider the binary value 0 or 1 as a number. For categorical variables, other correlation techniques can be used, or we can employ simple frequency counts.
A third approach, often used in practice, is to apply several techniques to evaluate the reliability, such as manual assignment together with correlation. In this way, if the different techniques agree, it will reinforce our confidence in the end result.
Another way to obtain more relevant variables is to derive factors in terms of existing ones. Ratios are typically used for numerical variables. For example, consider two variables, number of clicks and number of purchases. If we are evaluating the effectiveness of a publicity banner in an application website, we can derive a new ratio variable which will be number of purchases divided by the number of clicks. More sophisticated factors can be derived by data mining techniques such as factor analysis, regression and rule induction.
| David F. Nettleton is currently a contract researcher with the web research group of the Pompeu Fabra University, Barcelona, where he specializes in data mining applied to online social networks and data privacy. The author has more than 25 years of experience in IT system development, specializing in databases and data analysis. Nettleton earned a Bachelor of Science degree in computer science, Master of Science degree in computer software and systems design, and a Ph.D. in artificial intelligence. He has worked for IBM as a Business Intelligence Consultant, among other companies. You can contact the author at [email protected].
|
 |
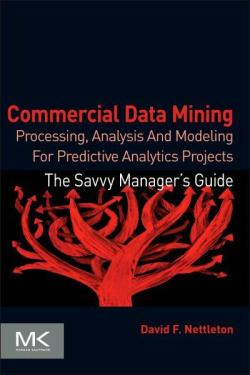
| The themes of data quality briefly considered in this article are covered in depth in Mr. Nettleton's latest book, Commercial Data Mining: Processing, Analysis, and Modeling for Predictive Analytics Projects. The book also discusses many other key themes such as the evaluation of business objectives, data capture, analysis and modeling, together with detailed case studies that illustrate them. |