Analytical Tools for Business Analysts
By Wayne W. Eckerson
Business analysts can benefit from three types of analytical tools: OLAP, visual discovery, and Excel-based tools. Visual discovery tools are the newest addition to the business analyst toolbox.
1. OLAP TOOLS.
Other than spreadsheets and desktop databases, OLAP tools have been popular with business analysts, especially financial analysts, who like being able to slice/dice data dimensionally and navigate up and down organizational, product, and account hierarchies at the speed of thought (which most OLAP tools support). From a business perspective, OLAP tools make it easy to uncover the root causes of problems, identify trends, and compare performance across groups.
OLAP tools store data in multidimensional databases or cubes, which are like spreadsheets on steroids—supporting multiple dimensions instead of just two. One downside of this approach is that the cubes contain only summary information, because it takes too long for OLAP databases to calculate data values at the intersection of every dimension in every hierarchy. Vendors of multidimensional databases—which include Oracle (Essbase), Microsoft (Analysis Services), and SAP (Business Warehouse)—have made great strides in expanding the amount of data that cubes can contain by dynamically calculating data within cubes and joining data across cubes. Some of these vendors have also made it possible for users to input data values to perform planning, budgeting, and “what-if” analyses.
Many vendors also provide graphical clients tools to access the databases, although Excel is still the preferred OLAP client in the finance department. SAP, for instance, is working on a new OLAP client code-named Pioneer that will blend the best of its Business Explorer (BEx), an Excel-based client for SAPBW geared to data analysts, and Business Objects Voyager, a graphical OLAP client designed for BI professionals, according to John MacGregor, product manager for Voyager. SAP has just introduced SAP Business Objects Explorer, which allows for data exploration on top of large volumes of data using the search paradigm and a highly visual user interface.
Some vendors have abandoned physical cubes and use SQL to dynamically create virtual cubes from relational databases. The two dominant vendors of this relational OLAP (orROLAP) approach are MicroStrategy with its MicroStrategy 9 product (which embeds ROLAP in a BI platform) and Oracle with its Oracle BI Extended Edition product, which it inherited from Siebel Analytics. Although ROLAP tools can address much larger volumes of data than MOLAP products, their query response times are slower. To address this problem, ROLAP vendors are making creative use of caches, 64-bit operating systems, and optimized and multi-pass SQL to provide consistently fast query performance.
2. VISUAL DISCOVERY TOOLS.
One of the fastest-growing toolsets for business analysts are visual discovery tools. Several sponsors of this report offer visual discovery tools, including ADVIZOR Solutions, TIBCO (which sells Spotfire Professional), SAS (which sells SAS JMP), and Tableau Software. The tools provide “speed of thought” analysis, conforming to the way business analysts want to consume and interact with data. Applications built with visual discovery tools are popular with casual users, who like the point-and-click filtering and drill-down to detail.
Versus BI tools. Unlike reporting tools, visual discovery tools provide sub-second response times for any action taken against the data (e.g., filtering, drilling, calculating, sorting, ranking) because they store data in memory instead of remote databases (although some can query databases dynamically as well). They are faster to deploy than BI tools, because the IT department doesn’t need to create a semantic layer or implement specific types of database schemas. Visual discovery tools also can be less expensive. A customer can purchase a few desktop licenses at $500 to $1,000 each to get started, then add a server extension later so power users can publish live, interactive views to others.
Visual discovery tools link tables that may not perfectly match, either in granularity or table relationships (e.g., one-to-one, one-to-many, many-to-many), according to Doug Cogswell, CEO of ADVIZOR Solutions. The flexibility to associate data across multiple tables makes it easy to use an attribute in one table to filter fields in multiple other tables on the fly, something that can be difficult to do in SQL.
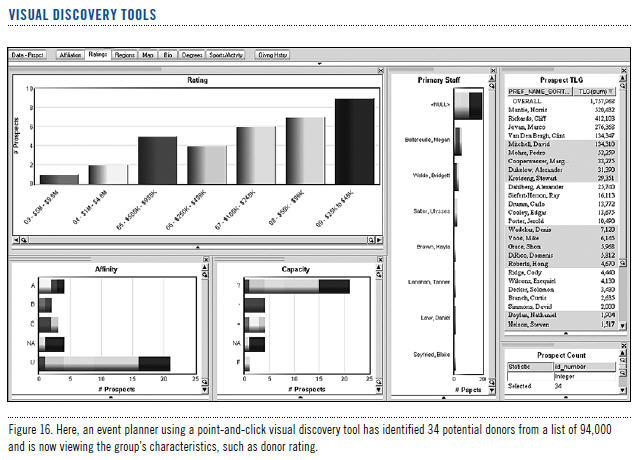
For example, suppose a university wants to invite potential donors for a new football/lacrosse complex to a dinner in New York City. Without IT assistance, and in less than 20 minutes, an event planner can use a visual discovery tool to identify 34 prospects from a list of 94,000 that played both football and lacrosse (a cross-table, one-to-many relationship), live in New York, New Jersey, or Connecticut, and have given more than$10,000 in the past five years (another cross-table, one-to-many relationship). Months later, when the university receives the donations, an analyst might create a statistical profile of the biggest givers and run it against the entire alumni population to identify other potential athletic facility donors.(See Figure 16.)
Visual discovery tools are quickly moving upstream, from desktop to departmental and enterprise applications. Most have beefed up their authoring and publishing capabilities so analysts can create highly interactive dashboard applications for casual users. For example, Spotfire Professional is a server-based, enterprise analytics platform that supports a range of functionality—from interactive reports and dashboards to statistics, data mining, data integration, and real-time data delivery.
The vendors also support innovative visualizations and data mining functions. For example, ADVIZOR Solutions supports 15 chart types, including standards such as pie, bar, and line charts, as well as more innovative types, such as scatter plots, heat maps, time tables, data constellations, and paraboxes. SAS JMP integrates a vast array of analytics, including regressions, clustering, choice experiments, and so on. Many vendors have also moved beyond nightly batch loads to support dynamic data delivery. For example, Tableau’s drag-and-drop interface provides multidimensional visualizations by dynamically querying relational databases, OLAP cubes, and enterprise data warehouses, including Teradata. The result is live, interactive dashboards and reports that can be shared via browser, workbook, and embedding in Web applications.
Versus spreadsheets. Unlike spreadsheets, visual discovery tools provide analysts with unbounded access to sizable volumes of raw data. A 32-bit desktop operating system with 2 GB of RAM can comfortably hold six to eight million rows of data. A 64-bit Windows 2003 server machine with16 GB of RAM can hold 20–50 million rows of data and 50 concurrent users without performance degradation. Some can hold more data by shuttling infrequently used data to disk.
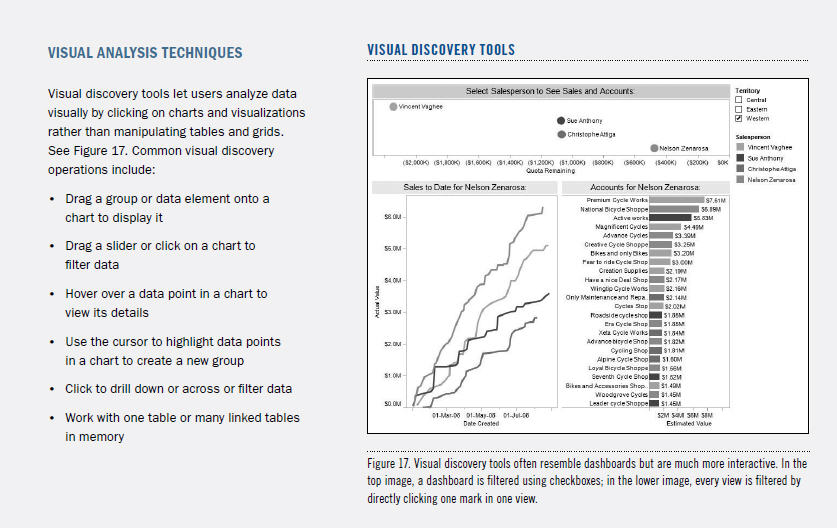
Visual discovery tools also provide more sophisticated, interactive charting and visualization than spreadsheets. Using a mouse to point and click and drag and drop, analysts can quickly identify patterns and outliers, explore causal relationships, compare performance among groups, and generate target lists or segments. In fact, most speed-of thought analysis is done visually, not with pivot tables or grids.(See the sidebar, “Visual Analysis Techniques.”)
Versus OLAP. Unlike most OLAP tools, visual discovery tools fit the structure of the question being asked rather than fitting the analysis to the structure of the data, according to William Smith, principal of Claraview, a division of Teradata. Visual discovery tools don’t need an IT person to design a dimensional data model based on rigid dimensions and hierarchies. As a result, the tools aren’t restricted to predefined navigation paths and hierarchies. In addition, the tools use a “load-and-go” approach in which analysts loadraw data from multiple sources and simply link tables along common keys to get a unified view of the data set. The tools typically load atomic-level data, not aggregated data via a lengthy calculation process. As a result, most visual discovery tools can be deployed in a few hours or days, depending on the complexity and cleanliness of source data.
Downsides. A BI purist might be quick to point out some of the downsides of visual discovery tools, especially when implemented independently of a BI platform and data warehousing environment: (1) They don’t address data quality issues, (2) they don’t generate standard reports, (3) the datasets are not persistent and must be refreshed from scratch each time there is a change (although some now support dynamic updates or direct query connections), (4) they don’t join large tables; they simply link them in memory, (5) they don’t support dimensions, aggregations, hierarchies, or predefined calculations, unless a designer spends time to model these constructs within the tool’s metadata (if allowed), and (6) performance will degrade if all the data can’t fit in memory.
Of course, most of these “deficits” don’t bother business analysts. For example, most prefer to work with raw data—defects and all—rather than aggregated or precalculated data filtered through a metadata layer. Most also don’t want the data to change underneath them and prefer to work with snapshots rather than dynamically changing data. The tools can help analysts perform rudimentary quality control because they make it easy to spot outliers.
3. EXCEL-BASED ANALYTICAL TOOLS.
Another important toolset for business analysts is Excel-based analytical tools. Because business analysts primarily use Excel to perform the bulk of their analyses, some vendors believe that forcing them to adopt a new interface is ludicrous. “If you can’t beat them, join them” is a common refrain.
Excel plug-ins. Of course, most of these vendors are well aware of the problems that Excel creates when used outside of a managed BI environment. That’s why most vendors offer BI tools in which Excel is the front-end to a BI server of some sort. Even Microsoft has recognized this problem and has gradually begun offering BI-friendly versions of Excel, such as Excel Services (a thin-client version of Excel that works with SharePoint) and SQL Server Table Services (an Excel plug-in for using data mining functions in Analysis Services).
Most leading BI vendors, such as SAP, SAS, and MicroStrategy, currently offer Microsoft Office plug-ins that let users view and interact with predefined BI reports as MSOffice documents, such as an Excel spreadsheet. The plug-ins maintain “live” connections to the BI reports so users always view the most up-to-date information. Most visual discovery tools flip that paradigm and source from Excel rather than publish to it. Tableau, for example, enables users to flip back and forth between the spreadsheet data and Tableau’s visualizations of it. Excel is one of the more popular sources of data for visual discovery tools.
Excel clients. Several vendors have gone a step further, making Excel a full-fledged client to their BI servers. This lets business analysts create reports natively in Excel (or an Excel look-alike) instead of having to create the reports in the BI tool and then export them to a file or download them to Excel via a smart plug-in.
For example, several vendors use Excel as a client to access one or more OLAP servers. XL Cubed and Microsoft run Excel natively against Microsoft Analysis Services; SAP’s BEx Analyzer runs against Business Warehouse; and Applix (now owned by IBM via Cognos) uses Excel to access TM1. Other vendors provide spreadsheet-based access to relational databases via an analytic server. Eivia provides thin-client access to an Excel-like spreadsheet that lets users perform what-if analyses against all dimensions and hierarchies in a data warehouse, which is not an easy task!
Other vendors have created Excel-based products that run on a desktop yet can be managed in a centralized fashion. For instance, Lyzasoft shipped a desktop tool in 2008 geared to business analysts that gives them an Excel-like interface to gather, analyze, and present data from multiple sources using an intuitive visual design tool. The tool traces the analyst’s steps, capturing the workflows in a central repository for reuse and auditing/monitoring by analysts and IT administrators, respectively. Model Sheet provides a Web-based modeling environment to create and maintain spreadsheet models, deliver them using conventional
Wayne W. Eckerson is the director of TDWI Research at The DataWarehousing Institute. He is an industry analyst and the author of Performance Dashboards: Measuring, Monitoring, and ManagingYour Business (John Wiley & Sons, 2005). He can be reached at [email protected].
This article was excerpted from the full, 28-page report, Beyond Reporting: Delivering Insights with Next-Generation Analytics. You can download this and other TDWI Research free of charge at tdwi.org/research/reportseries.
The report was sponsored by ADVIZOR Solutions, Inc.,MicroStrategy, Oracle, SAP, SAS, Tableau Software, TeradataCorporation, and TIBCO Spotfire.