 View online: tdwi.org/flashpoint


May 1, 2014
ANNOUNCEMENTS
NEW TDWI Best Practices Report
Evolving Data Warehouse Architectures in the Age of Big Data
NEW TDWI Checklist Report
Using Next-Generation Analytics to Gain Value from Enterprise Reports: Six Best Practices
CONTENTS

TDWI Salary Survey: Average Wages up 1.2 Percent in 2013

Agile Business Intelligence: A Practical Approach

BI/DW Job Satisfaction in 2013

Mistake: Underestimating the Value of Data Quality

See what's
current in TDWI Education, Events, Webinars,
and Marketplace
TDWI Salary Survey: Average Wages up 1.2 Percent in 2013
Mark Hammond
TDWI Contributing Analyst
Topics:
Program Management
The latest edition of TDWI’s popular annual salary report is out, offering BI professionals a unique opportunity to compare their wages, bonuses, job satisfaction, and other factors against the BI industry at large and across key roles.
For 2013, average salaries rose a lackluster 1.2 percent for full-time BI professionals in the U.S., who constitute 81 percent of our 1,350 survey respondents. Their average wages increased from $108,950 in 2012 to $110,265, while their median wages remained unchanged at $107,000, according to the 2014 TDWI Salary, Roles, and Responsibilities Report.
Across our full respondent pool, including freelance contractors and BI professionals in Canada, our fall 2013 online survey found that average BI salaries dipped less than 1 percent, from $107,538 in 2012 to $106,762 in 2013. A close look at the data, however, reveals several unique factors that influenced the results.
For one, the number of Canadian respondents in the survey increased substantially, from 11 percent in 2012 to 16 percent in 2013, the highest representation of Canadians in the survey’s history. The lower wages paid in Canada contributed to the decline--Canadian BI professionals made $21,666 less than their U.S. counterparts in 2013. For 2013, BI wages in Canada were up nominally, from $88,251 to $88,599, year over year.
Second, we saw a notable increase in smaller organizations (with $1 billion or less in annual revenue) participating in the survey. The representation of smaller organizations, which our survey has historically found to pay significantly less than larger organizations, rose from 43 percent in 2012 to 47 percent in 2013. Finally, the percentage of BI professionals 46 and older, who command the highest salaries from an age perspective, fell to 35 percent, the lowest level in five years.
Meanwhile, average bonuses remained steady at $14,502, up $250 from 2012, and the percentage of BI professionals pocketing a bonus was virtually unchanged at 63 percent.
Available exclusively to TDWI Premium Members, the 2014 TDWI Salary, Roles, and Responsibilities Report is a useful tool for both managers and employees to size up compensation trends by a variety of dimensions, including age, role, gender, IT certifications, industry, organizational revenues, and organizational BI maturity. It also analyzes non-compensation data such as job satisfaction, secondary roles, turnover, and top considerations for a new job. Some highlights include:
IT certifications. Securing several IT certifications is a proven way to increase earning power. In 2013, BI professionals with two certifications made $112,219¬--nearly $7,250 more than those with no certifications. Those holding one or more TDWI CBIP certifications did even better, with average wages of $114,613. What’s more, CBIP certificants averaged bonuses of $19,828--$5,326 more than the general population.
Job and earnings satisfaction. Fifty percent of respondents rated their job satisfaction as “high” or “very high,” and 49 percent believe they are fairly compensated. These numbers are virtually unchanged from 2012, indicating generally high and steady satisfaction in the BI workplace. [Editor's note: See this month's TDWI FlashPoint Snapshot.]
Gender. The traditional gender gap narrowed slightly in 2013, though women earned $12,250 less than their male counterparts. Women’s average salaries rose to a record-high $98,037, while their average bonuses leapt 19 percent, to $11,344, still substantially less than the $15,560 average bonus for men.
Role. A salary gap of nearly $51,000 separates BI directors, in the top spot at $136,903, and data analysts or modelers, at the bottom with average wages of $86,082. For those 76 percent of BI directors receiving a bonus (averaging $26,069), total compensation nets out to $163,000.
BI maturity. As in past years, organizations with the most mature BI infrastructures were the most generous with wages in 2013. BI professionals working in “advanced” environments made $111,054, roughly $10,000 more than those at “beginner” organizations.
Industry. Consulting and professional services remained high on the average salary scale among verticals, at $115,726. The top spot was claimed by media, entertainment, and publishing at $129,114, yet it should be noted that only 2 percent of respondents work in that industry. At the low end is state and local government, at $83,695.
Secondary roles. The average number of secondary roles fulfilled by BI professionals reached a new high of 3.6 in 2013, with the top secondary roles being data analyst or modeler, subject matter expert, and business requirements analyst. Organizations are making the most of multi-skilled BI professionals, but at the same time, BI professionals seem to relish the responsibilities--“challenging work” was cited as the top consideration for a new job.
Get more insights into the state of the BI industry with the full 2014 TDWI Salary, Roles, and Responsibilities Report, available to TDWI Premium Members.
Mark Hammond, is a veteran contributor to TDWI, including a number of research reports, Business Intelligence Journal, TDWI FlashPoint, and What Works.

Moving to Real-Time Decisions
James Taylor
Decision Management Solutions
Topics:
Business Analytics, Big Data Analytics, Data Analysis and Design
When it comes to analytics, many organizations focus on using analytic insight to improve executive decision making. Yet there is often an even greater opportunity when using analytics to improve operational decision making. Operational decisions about a single customer or transaction are made by call centers, local staff, and automated systems. These decisions affect everything from fraud to customer satisfaction, from risk management to resource utilization. Although each decision has a localized impact, enterprises make so many of these decisions that the cumulative impact is enormous.
Operational decisions must be increasingly made in real time, as illustrated by the scenarios below:
- Customers don’t want to return tomorrow or visit another branch to get the answers they need. They expect you to respond in real-time, 24/7. People are not real time, so customer service systems must make decisions.
- Customers don’t expect you to be out of stock, and with competitors a click away, decisions about your supply chain can’t wait either.
- Accepting transactions and checking for fraud later exposes you to massive losses if you are targeted, so you need to flag and reject fraudulent transactions before they get into your system.
- As automated channels, mobile devices, and other “unattended” interactions become the norm, real-time, automated decision making is critical.
In every case, the value of decisions tends to degrade over time. For the same quality of decision, a slower decision is worth less. Richard Hackathorn called this “decision latency.” Reducing decision latency--moving actions closer to the events that trigger them--adds value across the board. Even when a real-time response is not required, deciding faster is more valuable.
However, faster decisions and real-time response cannot come at the expense of decision quality. You must continue to make data-driven decisions--applying analytics to your decision making--even as you move to real time. To do this, you must broaden your analytic focus. Stop thinking of analytics only in terms of how to present data to improve decision making, and start thinking of analytics as a way to improve your ability to automate decisions and respond in real time.
We have historically shied away from automating decisions and restricted automation to low-value, low-complexity decisions. There are also high-value, high-complexity decisions that warrant the use of experts. This leaves many manual decisions that must be made by frontline workers who lack time or skills to be “expert” decision makers. With technologies such as business rules, data mining, and predictive analytics married to big data, we can now automate more of these decisions.
The key to delivering real-time responses is to move from presenting data for analysis to using advanced analytics to drive decision making. This shift of focus from data to decisions lets you build what are known as decision management systems--agile, analytic, and adaptive systems that automate and improve operational decisions. Developing these systems is a three-step process:
- Decision discovery: You must begin with the decision in mind, identifying and describing the decisions you need to manage. You can model decisions using emerging decision modeling approaches, such as Object Management Group’s Decision Model and Notation standard, to help you understand how to make these decisions and what information, analytics, and know-how must be available.
- Decision services: For the decisions that matter, build decision services. These service-oriented components assemble business rules and advanced analytics to make decisions. Plugged in to the processes and systems that run the business, they make decisions consistently across channels and put our data to work by leveraging analytic models produced using data mining and predictive analytic techniques.
- Decision analysis: Decision making is not static, so the outcomes need to be tracked across channels and systems to improve results. For a typical collection of systems, this means collecting a wide variety of often fast-moving data--big data--so you can analyze results. Analyzing this big data shows which decisions worked and which did not so we can improve and optimize decision making over time.
For organizations today, the right time to make a decision is often in real time. Customers want responses in real time, supply chains must adapt to disruption in real time, and fraud must be caught before it gets into the system, while self-service and Web applications cannot wait for human intervention. To deliver real-time responses and still take advantage of analytic, data-driven decision making, we need a new approach. Decision management gives you the power to respond in real time by automating and improving the operational decisions at the front line of your business.
James Taylor is a principal consultant at Decision Management Solutions and a leading expert in the use of business rules and advanced analytics. He is the author of several books and helps companies adopt decision-making technology.

Agile Business Intelligence: A Practical Approach
Justin Lovell
Plenty of vendors promise to solve all our business users’ problems or our technical teams’ problems with their tool sets and methodologies. With the mounting pressure on business intelligence (BI) teams (whether embedded in organizations or those of consultancies) to deliver on time and meet expectations, it is no wonder that the allure of agile BI has cast its net on unsuspecting teams desperate for success.
It is possible to learn from an execution and delivery methodology crafted around the concept of “team” rather than “individual.” This article looks at how teams can implement the agile mindset in building data output applications. It explains the concepts and how they relate to BI projects, rather than the typical data input applications managed through the software delivery life cycles commonly associated with the term agile.
Learn more: Read this article by downloading the Business Intelligence Journal, Vol. 19, No. 1


Highlight of key findings from TDWI's wide variety of research
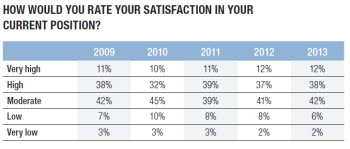
BI/DW Job Satisfaction in 2013
BI professionals remain fairly satisfied in their work. Fifty percent of respondents report a “high” or “very high” degree of job satisfaction, basically the same levels seen in the surveys of the past three years. Meanwhile, the incidence of “low” or “very low” job satisfaction dipped slightly to 8 percent, down from 11 percent in 2011. Overall, job satisfaction is up notably from the recession years of 2009–10.
As has been observed at TDWI conferences and on social media such as TDWI’s LinkedIn site, BI professionals are upbeat about the BI industry and the new challenges and opportunities around harnessing and analyzing big data. Many rightly believe that they and their teams deliver quantifiable benefits to their organizations, and that they play a role in advancing the art and science of utilizing information to improve organizational, and in many cases societal, well-being.
(Click for larger image)
Read the full report: Download the 2014 TDWI Salary, Roles, and Responsibilities Report


FlashPoint Rx prescribes a "Mistake to Avoid" for business intelligence and data warehousing professionals.
Mistake: Underestimating the Value of Data Quality
Lyndsay Wise
With a focus on business-driven applications, you run the risk of underestimating the value of data quality management, or thinking that data quality should be an IT-led initiative. IT needs to manage the process, but business-driven applications include targeted business rules and in-depth knowledge of the ins and outs of data. These ins and outs complement data quality definitions. Aside from inconsistent or duplicate records, subject matter experts (SMEs) will be able to identify data quality level acceptance, what types of issues should be flagged, and how they can be corrected. Once all of these considerations are taken into account, IT can develop an automated approach to management and lean on business stakeholders to manage new issues as they occur.
Business users need to realize that getting the best value from their BI and analytics investments requires having access to consistent, relevant, and correct data. Otherwise, you risk analyzing data that is invalid or conducting rework to develop a solution with trusted information. All too often, knowledge workers are stuck with access to information that they don’t trust, but have to work with anyway. Your BI solution should provide a way to address data trust issues by managing quality consistently.
Read the full issue: Download Ten Mistakes to Avoid When Bridging the Business/IT Divide (Q1 2014)

