Five Emerging Trends in Business Intelligence and Analytics
By David Stodder, Director, TDWI Research, Business Intelligence
Business intelligence and analytics are in high demand as organizations seek to use information assets to improve business outcomes, customer relationships, and operational efficiency. Yet, it has perhaps never been more challenging to keep up with the changing demands and expectations of a growing BI and analytics user community. IT-driven application development, limited access to historical data, and canned business reports are no longer satisfactory. Users want more control, better visualization and analysis capabilities, and faster development cycles.
Organizations are closely watching emerging technology trends to discover the next great competitive advantage in the use of information. One trend is easy to identify: more information. Data volumes are growing across the board, with organizations seeking to tap new sources generated by social media and online customer behavior. This trend is spurring tremendous interest in better access and analysis of the variety of information available in unstructured or semi-structured content sources.
This article explores five major trends that are driving the implementation of emerging, cutting-edge technologies for BI and analytics. The first four trends focus on changes wrought by user demands for more self-service capabilities and access to a broader selection of information sources. The fifth trend considers the end game of BI and analytics, where process efficiency is the key objective: automated decisions.
1. Data Discovery Accelerates Self-Service BI and Analytics
From a macro perspective, it’s easy to identify the biggest long-term trend in business intelligence: providing nontechnical users with the tools and capabilities to access, analyze, and share data on their own. However, the road to this destination has not been easy. With IT driving application development and deployment, standard approaches to extending enterprise BI and data analysis capabilities have been difficult and slow. Getting the requirements right for the data, reports, visualization, and drill-down analysis capabilities is difficult and never fully satisfactory. By the time requirements have been gathered and turned into application features, users will have identified different requirements.
Today, “data discovery” technology is leading the way toward making it possible for users to determine their own BI requirements by authoring reports, assembling their own dashboards, and so on. Users across organizations have varying degrees of experience with data, as well as clarity about what kind of reports, visualizations, and analysis capabilities they want. For some, simple, shareable reports with good visuals are enough; others require more control of development options. Data discovery tools are cut from the same cloth as BI tools, but also provide users with greater self-service capabilities—that is, more control of their environment, including the ability to do rapid proof-of-concept applications that could ultimately be deployed more widely by IT.
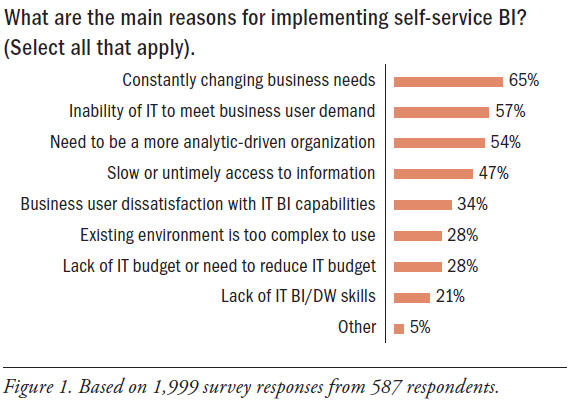
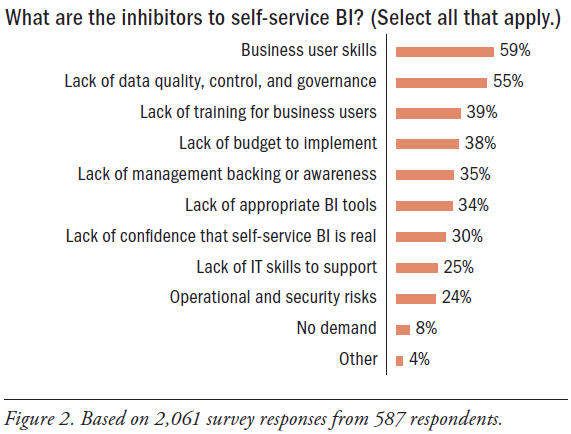
TDWI’s recent Best Practices Report, Self-Service Business Intelligence: Empowering Users to Generate Insights (Q3 2011), found that responding to constantly changing business needs is the dominant reason organizations are seeking self-service capabilities. At the same time, however, giving users more control of their BI and analytics environments raises concerns about inadequate user skills and the potential for data quality, control, and governance problems. (See Figures 1 and 2.)
Leading data discovery tools offer users the option of implementing in-memory analytics, which can be a good choice depending on workloads and the types of queries made. Data discovery tools employ inexpensive memory to bring selected detailed data closer to users, enabling them to test predictive models and perform iterative analysis without incurring the performance issues of accessing data on disk. Some data discovery tools include search capabilities and extended or hybrid SQL for different types of data, such as semi-structured “big data” found in social media and geographical location data. Some tools are also able to mask or encapsulate ETL, metadata, and other information management concerns to shield users from having to know the complexities of data access.
Analytics is all about discovery; users need the flexibility to ask new questions of the data as they move through their analysis. Along with self-service dashboard creation and visualization choices to improve reporting, data discovery tools give users the ability to perform what-if analysis and dive deeper into detailed data. The new tools in the market are putting pressure on market-leading BI systems to catch up. The result is a positive trend for users toward greater self-service and more BI agility without sacrificing analytical flexibility and depth.
2. Unified Access and Analysis of All Types of Information Improves User Productivity
As the implementation of BI and analytics tools spreads to more users within organizations, a question inevitably arises: What about all the information in text and document formats, which accounts for the vast majority of what users encounter? Difficulty in finding information, whether structured or unstructured, is a productivity cost to organizations. If one of the measures of BI’s value is improved productivity, then BI should help users access and analyze unstructured as well as structured information.
Historically, BI systems have developed in technology ecosystems limited to structured, alphanumeric data, leaving unstructured content to document and content management systems, search engines, and a lot of manual paperwork. With the majority of content increasingly being stored and generated in digital form, users are demanding better integration between content access and analysis and the structured realm of BI. Integrated views of all types of information can help managers and frontline workers see the context surrounding the numbers in structured systems. This enables them to uncover business opportunities and find the root causes of problems more quickly.
BI and data discovery tools are advancing the integration of search capabilities into the user experience to help users find reports and other BI artifacts more quickly, and search for information inside internal content sources and on the Web. However, products in the search-centric unified information access (UIA) tool category have been moving faster to bring search and SQL-based access and analysis together in one environment. With UIA tools, users can explore information that is not represented in the BI system’s metadata. Search options are more expansive in UIA tools than in most BI systems, with support for sophisticated concept classification, faceted search, and inverted indexes to speed the discovery of information.
The unification of access and analysis of structured and unstructured data is an important emerging trend in BI, data discovery, and UIA. This unification is critical to giving users a complete view of information about customers, patients, products, and other objects of interest. For managers and frontline employees accountable for processes that are both data- and content-intensive, the unification will help them use information to increase efficiency, productivity, and business agility.
3. Big Data Generated by Social Media Drives Innovation in Customer Analytics
Customer data intelligence has long been a major driver behind growth in the implementation of sophisticated analytics for prediction and pattern recognition as well as advanced data warehousing. In the brick-and-mortar days, organizations wanted to slice, dice, and mine transaction data and interpret it against demographic information. Advanced organizations sought to mine the data to uncover buying patterns and product affinities. As e-commerce and call centers proliferated, organizations needed to expand customer analysis to include interaction information recorded in all channels, bringing more terabytes into their data warehouses.
Now, with Twitter, Facebook, and other sites, we have hit the social media age: customers are using social networks to influence others and express their shopping interests and experiences. Organizations are hungry to capture and analyze activity by current and potential customers in social networks and comment fields across the Internet marketplace.
The race is on to gain business advantage from social media activity. Organizations born in the Internet age live and die by this information; eBay, LinkedIn, Yahoo!, Zynga, and others use it to influence feature development and content placement on their Web sites in real time. Firms with physical and online sales channels hope to gain new perspectives on customer satisfaction with experiences in each channel. These organizations want to do more than just track social network activity; they want to use insights to improve marketing strategies, customer service, product development, and more.
The big data generated by social media is a magnet for many types of advanced analytics, including some that break away from standard data warehousing designs and practices. Hadoop and MapReduce give developers frameworks and techniques for data-intensive applications that let them bypass some of the structural requirements of traditional relational data warehouses. This helps to more quickly and inexpensively leverage the power of massively parallel platforms for deep analysis of large volumes of data. Hadoop’s growth is shared by an explosion in open source database technology development that includes Cassandra, Hive, MongoDB, Pig, and others, which are used by developers to both avoid the price tag of established database systems and enable them to implement the exact functionality they need for analysis of social media and online behavior.
Established BI, analytics, and data warehousing systems are beginning to integrate, incorporate, and provide access to Hadoop files. Thus, the emerging trend may be as much the integration of exotic data analysis technologies and frameworks into traditional systems as it is the growth in their implementation. How these technology trends and practices play out will have a “big data” impact on customer analytics.
4. Text Analytics Enables Organizations to Interpret Social Media Sentiment Trends and Commentary
Rising interest in social media analysis is putting the spotlight on text analytics, which is the critical technology for understanding “sentiment” in social media, as well as customer reviews and other content sources. Like data mining, the text mining and analytics category stretches to include a range of techniques and software, such as natural language processing, relationship extraction, visualization, and predictive analysis.
Text analytics falls within the realm of interpretation rather than exact science, which makes it a nice complement to BI and structured data analytics. Sentiment analysis, for example, employs statistical and linguistic text analysis methods to understand positive and negative comments. While this analysis can provide an early sense of the reception of a new product or service, the interpretation cannot replace the more exacting analysis of the numbers done with BI or structured analytics tools. Sentiment analysis, however, can help organizations become more proactive in taking steps to address negative reactions to products and services before they lead to the poor sales that BI and data warehouse users detect later in the reporting and analysis of sales transaction figures.
While social media analysis gets the headlines, text analytics is proving highly useful for understanding sentiments expressed by customers interacting with call or contact centers. Due to a lack of tools, many organizations record “voice of the customer” (VOC) comments in calls and customer surveys, but are unable to analyze and share them with any rigor or regularity. Organizations can turn sentiment analysis techniques loose on VOC comments to detect levels of anger or dissatisfaction. Leading organizations then use sophisticated presentation tools to visualize, in near real time, where and when they are seeing a rise in certain sentiments in VOC comments, which could indicate a widespread problem with products, services, or incorrect marketing offers.
Social networks enable customers to exchange information in a neutral setting that can be rich with clues about the success or failure of certain products and services. In healthcare contexts, for example, text analytics can help organizations monitor social networks to understand how patients are experiencing certain drugs or other treatments. Some healthcare organizations and pharmaceutical providers can then implement alerts or systems to detect the use of certain phrases or words so that they can respond to problems rapidly.
Text analytics is still a maturing field that features much experimentation and study of the effectiveness of tools and practices. However, current and potential contributions to a range of business operations and processes make text analytics a powerful emerging technology.
5. Decision Management Enables Organizations to be Predictive and Proactive in Real Time
Trailblazing organizations in many industries are applying automated information technology to dramatically reduce, if not eliminate, delays in how they respond to customer interactions, adjust to changes in supply chains, prevent fraudulent activity, and more. The goal is to operate in as close to real time as possible. Along with automation, organizations are striving to use information analysis to become predictive and proactive. The objective is to develop predictive models and forecast behavior patterns so that organizations can anticipate certain events; then, they can orchestrate processes so that they can be proactive and fully prepared when predicted events or patterns occur.
When limited to a reactive posture, organizations face delays and confusion in how to respond to events, which can lead to increased costs and missed opportunities. Reactive organizations lack a well-orchestrated plan and can only respond to events on a case-by-case basis. With speed and complexity rising in many industries, a reactive posture isn’t good enough. Organizations need business intelligence and analytics applications and services that will help them shift from a reactive to a proactive and predictive posture. Traditional BI systems are not enough for organizations to make this shift.
Decision management is the term industry experts and vendors use to describe the integration of analytics with business rules and process management systems to achieve a predictive and proactive posture in a real-time world. Decision management requires several technologies. Business rules, or conditional statements for guiding decision processes, are common in application code and logic; the challenge is to implement business rules systems that can guide decisions across applications and processes, not just within one system. Business process management systems help organizations optimize processes that cross applications and use analytics as part of the continuous improvement of those processes.
Along with business rules and business process management, a third technology important to decision management is complex (or business) event processing. Events are happening everywhere; they are recorded or “sensed” from online behavior, RFID tags, manufacturing systems, surveillance, financial services trading, and so on. Integrated with analytics and data visualization, event processing systems can enable organizations to pick out meaningful events from a stream or “cloud” of noise that is not important.
Organizations can use decision management technologies to automate decisions where speed and complexity overwhelm human-centered decision processes, and where there are competitive advantages to having decisions executed in real time and driven by predictive models. Decision management is an emerging technology area currently focused on specialized systems, but as demand for greater execution speed and efficiency grows, more organizations will evaluate its potential for mainstream requirements.
The Shape of Things to Come
Picking just five trends is not easy, given that we are in an exciting phase of innovation—particularly regarding the access and analysis of big data, including social media content and data for new forms of investigation, such as geospatial analysis. In addition, the trends are unfolding as the infrastructure of computing is changing dramatically to include cloud platforms and the vast, worldwide adoption of mobile devices. So, while I did not identify either cloud computing or mobile adoption among the trends in this article, these platform shifts should be kept in mind as context for how the trends are likely to play out.
What do you see as the major emerging trends shaping the implementation of BI and analytics? Let us know: TDWI invites you to discuss and debate the future of BI and analytics in our LinkedIn group. We look forward to your comments!
David Stodder is director of TDWI Research for business intelligence. He focuses on providing research-based insights and best practices for organizations implementing BI, analytics, data discovery, data visualization, performance management, and related technologies and methods. Stodder has provided thought leadership about BI, analytics, information management, and IT management for over two decades. Previously, he headed up his own independent firm and served as vice president and research director with Ventana Research. He was the founding chief editor of Intelligent Enterprise and served as editorial director for nine years. He was also one of the founders of Database Programming & Design magazine. You can reach him at [email protected].
This article originally appeared in the issue of .