
 View online: tdwi.org/flashpoint


August 6, 2015
ANNOUNCEMENTS
NEW Data Innovations Showcase
Getting to the Big Picture with Text Analytics: More Than Just Parsing Text
NEW Data Innovations Showcase
Making SAP ERP Data Useful for Business Analytics
NEW Best Practices Report
Visual Analytics for Making Smarter Decisions Faster
NEW Checklist Report
Using and Choosing a Cloud Solution for Data Warehousing
CONTENTS


Big Data Analytics in a Connected World

Hadoop Adoption Is Accelerating

Mistake: Excluding Data from Beyond the Enterprise

See what's
current in TDWI Education, Events, Webinars,
and Marketplace
Putting Big Data to Use
Chris Adamson
Oakton Software LLC
Big data expands the scope of business intelligence (BI) to include information and technologies that were previously out of reach. The hype is usually focused on the technologies, but the value always comes from the information.
Successful programs incorporate big data into their information architecture in four ways. In each case, new data management technology serves a specific purpose with respect to business information.
1. Capture potentially useful data sets
The first step in attaining business value is to capture potentially useful data. Here, relational storage may not fit the bill because it requires a predefined model that specifies the structure and meaning of the content. This implies that the value of the data is already understood, involves a lengthy modeling process, requires data integration, and may not be effective for large data volumes.
These drawbacks can be avoided with non-relational storage. Data intake can occur without a model, at a significantly lower cost, and with great speed. Placing Web log data into a non-relational store, for example, makes it available without requiring an intensive requirements effort and expensive data transformation process.
The danger is stopping here. The creation of a data lake that can ingest new and different data on demand quickly generates new problems, becoming the modern equivalent of the reporting tables that proliferated in the 1990s. As with those tables, it is necessary to take control of this new information resource.
2. Explore data sets for business value
Exploration is the search for value in a data set. Exploration applies analytic methods to captured data, often combining it with existing enterprise data. The goal is to develop insights the business can use to improve performance.
Exploration is often treated as an open-ended technical activity and placed into the hands of programmers and data scientists. This is a dangerous approach—left unchecked, it will devolve into a never-ending cycle that drains resources and funds while failing to identify insights the business is willing to act on.
Successful programs carefully define the scope of exploration efforts and engage people who understand the business. This begins by identifying a sponsor who owns a business problem and is willing to act on insights drawn from data. The scope targets a business key performance indicator (KPI) and includes subject matter experts who can collaborate with technical personnel.
Exploration requires the implementation of a sandbox, where the team can combine new data sources with existing enterprise data. The sandbox and corresponding raw data from the capture stage should have an expiration date. Once the project is over, the data is either eliminated or operationalized.
3. Augment the data warehouse
Once the business has identified the value of non-relational data, some of it will prove useful to track on a regular basis. Examples include the potential lifetime value of a customer, the risk level of a financial position, and predicted graduation outcomes.
The things we track and monitor over time are a natural fit for schema-driven relational storage. Better yet, they already have a home: the data warehouse.
Augmentation appends the outputs of analytics and data mining to information that is already tracked in data marts. A customer lifetime value calculation is added to a customer dimension; a risk model computes facts describing financial positions. This behavioral data becomes available to users of OLAP solutions and can also be surfaced on dashboards and scorecards.
Here, non-relational data storage serves as a staging area for the data warehouse; analytic methods become transformation rules, and their application becomes part of the data integration process.
4. Extend the data warehouse
A longstanding best practice in BI requires the data warehouse to contain the most granular data possible. Traditionally, the atomic level was an enterprise transaction—an order line, a delivery, a medical bill.
Big data affords the opportunity to go “subatomic.” What was the series of Web interactions that led to the order? Where and when was the package scanned while en route to its destination? These real-world events are now in reach but may not belong in the data warehouse.
This subatomic data is the new lowest level of detail. It can be stored in a non-relational store, where it serves as a drill-through target from traditional OLAP applications. The non-relational data is placed in a persistent repository that acts as an extension of the data warehouse, with attendant operational processes to keep it up to date.
To facilitate this drill-through linkage, it is important to maintain appropriate transaction identifiers and reference codes in both the OLAP world and the non-relational world.
Summary: The Big Data Information Life Cycle
Successful BI programs handle these big data use cases as a life cycle. Capture potentially valuable data and explore it for value. When no value is found, it is purged or archived. Where value is found, it is operationalized and the data warehouse may be augmented or extended. People use these insights to impact KPIs, producing measurable return on investment.
Chris Adamson develops BI strategies and designs information architectures for major corporations, governments, and software vendors. In addition to speaking and teaching worldwide, he is the author of several books on business intelligence, including the well-received Star Schema: The Complete Reference (McGraw-Hill, 2010). Adamson offers BI Services through his company, Oakton Software LLC. Join him at the TDWI Conference in San Diego this September for “Data Modeling in the Age of Big Data” and “Dimensional Modeling: Intermediate and Advanced Techniques.”


Big Data Analytics in a Connected World
Kurt Stockinger, Frank van Lingen, and Marco Valente
Enterprises often struggle with the design of big data architectures. Some argue that the traditional data warehouse is the silver bullet for solving most data-intensive enterprise problems; others claim that the new big data ecosystem based on Hadoop is a much better solution.
In this article we discuss industry analytics use cases with a particular focus on the Internet of things (IoT), describe the challenges and opportunities of each case, and provide guidelines and best practices for choosing the most appropriate technology.
Learn more: Read this article by downloading the Business Intelligence Journal, Vol. 20, No. 2.

Highlight of key findings from TDWI's wide variety of research
Hadoop Adoption Is Accelerating
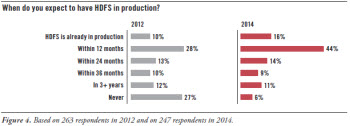
In late 2014, our survey asked a question that was first asked in a TDWI survey conducted in late 2012, namely: “When do you expect to have HDFS [Hadoop Distributed File System] in production?” Comparing the results of the two surveys shows that Hadoop adoption is up. (See Figure 4.)
Clusters in production are up 60%. In the 2014 survey, 16% of respondents report having HDFS already in production, which is a 60% gain over the 2012 survey. That’s an impressive gain for a two-year period. HDFS is still being used by a minority of users and organizations; but if these gains continue, it will become a majority practice within five years.
Many more clusters will come online soon. A substantial gain is seen in the number of respondents expecting to bring HDFS clusters into production within 12 months, up from 28% in 2012 to 44% in 2014. If users’ plans pan out, 60% of respondents will be in production by the first quarter of 2016, which is a huge leap from the current 16%.
Very few organizations have ruled out Hadoop. The percentage of respondents expecting to “never” deploy HDFS dropped from 27% in 2012 to 6% in 2014. This suggests a higher level of commitment from the user community than Hadoop has enjoyed in the past.
(Click for larger image)
Read the full report: Download Hadoop for the Enterprise (Q2 2015).


FlashPoint Rx prescribes a "Mistake to Avoid" for business intelligence and data warehousing professionals.
Mistake: Excluding Data from Beyond the Enterprise
Philip Russom
Enterprise data helps you understand customer behavior when your customer interacts with your enterprise—but how do they behave outside the context of your enterprise, and what information is missing from your enterprise view of each customer?
Data from third parties can help you answer these questions and fill the holes in your information. A wide range of third-party data aggregators can provide additional demographic information about the mass consumers and other people in your customer base. This is strongly relevant to master data management (MDM) because third-party data is regularly appended to reference records to augment your understanding of your customers and prospects. This form of “data append” is generally a median maturity requirement that extends the value of reference data after a base MDM solution is in place.
Although not a pressing requirement today, MDM maturing will eventually lead to the integration of social media data and similar information from other Web sources. For example, sentiment analysis is already based on social media and other Internet behaviors; imagine appending sentiment rankings to reference data about products or Internet behavior metrics to customer records.
Customers aside, business partners are equally mysterious from an enterprise data standpoint. Again, there are third-party data aggregators that can provide so-called firmographic information, ownership and investor information, debt ratings, and financial assessments about your business partners that you can use to augment your reference data about partners, transactions with them, and supply chain activity.
Read the full issue: Download Ten Mistakes to Avoid When Growing Your MDM Program (Q2 2015).

