 View online: tdwi.org/flashpoint


April 4, 2013
ANNOUNCEMENTS
Call for entries:
TDWI Best Practices Awards 2013
NEW TDWI Checklist Report:
Trusted Information for Analytics
NEW TDWI Checklist Report:
Seven Steps to Making Big Data Accessible to Executives
CONTENTS

Operational Considerations for a Business Intelligence Initiative

Beyond Listening: Six Steps for Integrating and Acting on Social Media

High Performance: Problem or Opportunity?


See what's
current in TDWI Education, Events, Webinars,
and Marketplace
Operational Considerations for a Business Intelligence Initiative
Mangesh Mharolkar
XTIVIA, Inc.
Topics:
Business Intelligence, Performance Management, Program Management
As professionals working in the business intelligence (BI) and data warehousing field, if we’re not posing questions of our data warehouse, we’re asking ourselves questions--especially about how to do our job better or maximize the value of our warehouse.
Here are three common questions and help in answering them.
1. How can I run my BI program so that it maximizes value for the organization?
Recognize that the BI initiative is uniquely positioned to guide your internal users to particularly beneficial outcomes.
Market Analysis
Did you just read the word market? You sure did. It is time to broaden our vision and realize that consumers are unique. They all have different needs, perspectives, and expectations about the products or services we offer them. Remember to craft your BI products and services to each consumer or user sector so they can best interpret and leverage them for the greatest impact.
Segment the users. Speak briefly with your consumers and you will recognize broad user categories. Document the requirements you receive from the users and apply the proper segmentation labels. It is perfectly acceptable to create as many segment labels as you need--this helps with the requirements analysis.
It is also important to understand the decision process end users will go through. Realize that the typical decision process starts with problem recognition. This is the most important step. Work with your consumers to clarify the problem. Understand that they will conduct a search, then evaluate alternatives, before making a final choice. Finally, the outcomes or end results must be closely tied to the problem.
2. How do I align objectives for my team with our corporate strategy?
Competitive Priorities
Leverage your competitive advantage by aligning your target objectives with your corporate and segment strategies. Target your requirements analysis to streamline your process and make it responsive and repeatable. Make sure your requirements analysis accounts for cost, quality, time, and flexibility to maximize the potential impact.
- Cost: Categorizing your cost requirements into lowest- to highest-hanging fruits enables you to deliver cost-effective projects. Better yet, cross-reference the low-hanging fruit with the greatest impact potential or urgency to market: your “best bang for the buck” factor. The goal is to keep costs low within a target range. First, target the requirements that align with your BI architecture. Minimize expenses by tabling the requirements that necessitate a capital investment. Educate your business users about the why, when, and what (that is, what product) they should expect during the next release.
- Quality: The general size of the consumer segment dictates the quality of the product. For a fairly large number of consumers, the focus should be on consistent quality. Make the user interface intuitive and easy to use. If you are building a product for a smaller consumer segment, such as power users, focus on performance quality.
- Time: Always consider time. What’s the delivery speed for a particular release? Will we be able to deliver on time? What’s our development speed (how quickly can we deliver an analytical platform)? What is the risk of a project overrun? The old adage applies: “Under commit, over deliver.”
- Flexibility: This is often ignored by BI teams. When delivering BI projects, always look at the customization required. This impacts the cost and time measures. Also look for variety and volume flexibility. Remember to combine reports/analysis when possible. Typically, the more diverse the data sources, the longer it will take to extract, transform, and consume the data.
3. How do I reach more business users and how do I keep them all happy?
Product/Project Design and Delivery
Once you complete the market analysis and prioritize key measures, you are ready to design, analyze, and develop the product. After each project cycle, do not forget to measure the compatibility of your program to the functional area (i.e., finance, accounting, HR) strategies. Make sure the various departmental/segmented users understand how the BI program is moving in step with their strategies.
Capabilities
Combining the assessment of your current capabilities with the product/project design and delivery features forms the feedback loop. Make sure to update the current capabilities and document the required and planned capabilities in conjunction with market analysis and competitive priorities. Your understanding of your capabilities should be scalable up and down your user groups and your organization’s strategic initiative. Review this feedback loop periodically to find ways to tweak and enhance your process for effectiveness and repeatability.
Mangesh Mharolkar has worked for over 17 years with information systems and currently heads the BI practice at XTIVIA, Inc. He has worked in various roles for client firms of all sizes, including Fortune 500 companies, building industry-leading data warehousing and BI solutions. He practices a very hands-on, practical approach to both strategic and tactical decision making with BI initiatives.


Beyond Listening: Six Steps for Integrating and Acting on Social Media
Scott Walters
The onset of social media technologies has fundamentally changed the way people communicate and network with other people. Because of these technologies, information flows instantaneously between friends, family, and businesses via numerous devices.
Although much of this content relates to noncommercial topics, an explosion of business-to-consumer and consumer-to-business interactions via social channels has changed consumer behavior and their expectations about how they interact and transact with businesses.
Social networking channels contain vast amounts of consumer behavior information. Much of this social media activity can be tied back to individuals to create highly valuable customer profiles. Leveraging social media data to create more complete customer profiles is critical to effective marketing. Enterprises that understand their customers and engage with them on their terms--when and where they want--will be at a significant competitive advantage.
Find out the six steps to take advantage of social media by downloading this article.
Read the full article and more: Download Business Intelligence Journal, Vol. 18, No. 1


Highlight of key findings from TDWI's wide variety of research
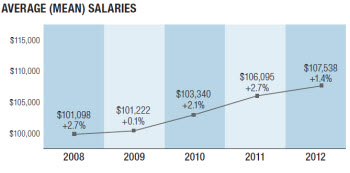
Salary Trends
Average salary growth slowed in 2012, with a modest 1.4 percent rise compared to 2011, to $107,538. This increase is the smallest since 2009, and notably less than the 2.1 percent and 2.7 percent increases recorded for 2010 and 2011, respectively. However, a closer look at the numbers shows that the news is not as disheartening as it might seem for the vast majority of BI/DW professionals.
Average wages rose 2.3 percent for full-time BI/DW practitioners--96 percent of our respondent pool--to a new high of $106,818. This increase was offset, however, by a precipitous drop in average wages reported by independent or freelance consultants (4 percent of respondents). Their average salary dropped 16.1 percent, from an unusual high of $144,194 in 2011 to $120,978, a figure more in line with previous years.
(Click for larger image)
Read the full report: Download the 2013 TDWI Salary, Roles, and Responsibilities Report
Highlight of key findings from TDWI's wide variety of research
High Performance: Problem or Opportunity?
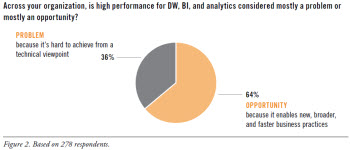
In recent years, TDWI has seen many user organizations adopt new vendor platforms and user best practices that helped them overcome some of the performance issues that have dogged them for years, especially data volume scalability and real-time data movement for operational BI. With that progress in mind, a TDWI survey asked: “Across your organization, is high performance for DW, BI, and analytics considered mostly a problem or mostly an opportunity?” (See Figure 2.)
Two-thirds (64%) consider high performance an opportunity. This positive assessment isn’t surprising, given the success of real-time practices such as operational BI. Similarly, many user organizations have turned the corner on big data--no longer struggling to merely manage it, but instead leveraging its valuable information through exploratory or predictive analytics to discover new facts about customers, markets, partners, costs, and operations.
Only one-third (36%) consider high performance a problem. Unfortunately, some organizations still struggle to meet user expectations and service-level agreements for queries, cubes, reports, and analytic workloads. Data volume alone is a showstopper for some organizations. Common performance bottlenecks center on loading large data volumes into a data warehouse, running reports that involve complex table joins, and presenting time-sensitive data to business managers.
(Click for larger image)
Read the full report: Download High-Performance Data Warehousing


FlashPoint Rx prescribes a "Mistake to Avoid" for business intelligence and data warehousing professionals.
Mistake: Lack of Data Quality
Krish Krishnan
Lack of data quality can ruin analytics in any organization. With big data, overall data quality can degrade as you integrate unstructured and semi-structured data. Although data quality is an important issue to understand and resolve prior to processing big data, you must determine how to improve the quality of data that may not be generated or owned by your organization.
In the case of unstructured data, text data quality can be improved by using language correction libraries prior to processing. If languages must be translated, then user inputs can provide the appropriate contextualization rules as needed for each linguistic connotation in speech or text. In the case of image and video files, data quality is determined at the source. If the data is sourced from Internet sites or third parties, you can use semantic libraries, taxonomies, and ontologies with user inputs to improve the quality of data.
For semi-structured data with text or numeric values, correct the data as you would textual data. User inputs are critical to ensure the validity of the data and its context.
Improving the overall data quality is an important consideration for processing big data. Although this is a tedious exercise in many cases, without this step the output produces skewed results and will negatively impact the analytical systems in the enterprise.
Read the full issue: Download Ten Mistakes to Avoid In Your Big Data Implementation (Q1 2013)

