
 View online: tdwi.org/flashpoint


July 2, 2015
ANNOUNCEMENTS
NEW Data Innovations Showcase
Hadoop: A Slam-Dunk DM Platform
CONTENTS


Fundamental Mind Shifts for the Future of Data Analytics

Best Practices for Next-Gen Analytics and Platforms

Mistake: Not Integrating Workflow and Process Management into MDM Solutions

See what's
current in TDWI Education, Events, Webinars,
and Marketplace
Let the Users Play
Patty Haines
Chimney Rock Information Solutions
During the life of a business intelligence/data warehousing (BI/DW) environment, many BI/DW teams find that data is not used or is used in different ways than originally intended. Tables and processes have been developed and put into production for data that is never touched. Users may need their data in an entirely different format after they work with the data and learn more about its characteristics. This can result in redesign, rebuild, and reload work effort.
What can be done to help BI/DW teams continue to develop and implement useful data in a meaningful way and reduce rework? One option is to provide a data sandbox or discovery area where users can work with data before the requirements and design begin.
This sandbox can be used to understand different sets of data and the data’s characteristics, as well as valid relationships with other data within the BI/DW environment. Data is loaded into a discovery area with little concern for table design, performance, data quality, integrity, documentation, and standard production processes. Data is made available as quickly as possible, where access to standard BI/DW tables is also available to users.
A sandbox is an excellent tool to help evaluate external data, new pieces of data, unstructured data, new presentation methods, and new tools and processes. It provides a place to determine whether data has the expected value before spending time and money developing tables and processes to populate within the production BI/DW environment. Users can determine whether data provides what is expected before committing a budget and BI/DW team to the work of migrating and integrating this data into the production BI/DW environment.
1. Evaluate external data
External data is a valuable resource, many times providing missing data when merged with an organization’s internal information. With the vast amount and ease of access to external data, this data should be considered part of an organization’s data assets, including data from government studies, outside reports, white papers, social media, industry surveys, medical groups, marketing databases, personal databases, and research centers. External data can provide valuable insight into an organization’s products, markets, and customers. However, BI/DW teams often face challenges working with external data that may not be of the same quality or may not easily link to internal data.
External data can be better evaluated and utilized by first loading it into a sandbox to learn how best to integrate this data into the organization. This provides a controlled location where data can be studied and worked with to evaluate how it can be used, along with its quality, usefulness, domain values, and possible links to other types of data within the BI/DW environment.
2. Evaluate and profile new data sources
New data sources can be profiled within a sandbox to determine its value within the BI/DW environment. There is little time and effort lost if data is found to be not useful, while in the sandbox. This environment can also be used to identify data quality issues, missing data, business rules that need to be applied, and domain values, as well as develop and vet business names and definitions.
It is also important to determine if and how data can be linked to existing data within the BI/DW environment. Understanding data before the design phase can help you design more effective tables and processes. New business rules can be developed and tested prior to the final design of the transformation rules required to populate this data within the BI/DW environment.
3. Integrate unstructured data
The sandbox can be used to experiment with unstructured data, including social media, sales rep notes, survey notes, clinic trial notes, e-mail messages, and contracts. New methods and tools can be tested and evaluated within this environment to determine if the unstructured data can bring additional value and benefit to the organization. The sandbox can be used to integrate unstructured data with structured data to evaluate the added value to the organization.
4. Evaluate new presentation methods and tools
The sandbox can also be used to examine new presentation methods—moving from reports to dashboards to scorecards. This environment can be used by data architects to design new structures that work more effectively with certain data for ETL, access, and presentation.
New tools and methods are continually being introduced for processing, integrating, analyzing, and modeling of data. New technologies are being used within BI/DW environments for big data, statistical modeling, data mining, federation, virtualization, and in-memory tools. The sandbox provides an excellent environment for evaluating whether these tools would be a good fit within the BI/DW environment.
Summary
Some of our challenges in building and maintaining a BI/DW environment are to provide new data and information quickly at a lower cost—to get data into the hands of users as soon as possible while maintaining high quality. Using a sandbox can improve the effectiveness of the BI/DW team providing data and an information environment that truly adds value to the organization.
It’s time to let the users “play”—to provide a sandbox for the users that will help the BI/DW team become more effective in the delivery and support of the BI/DW environment.
Patty Haines is founder of Chimney Rock Information Solutions, a company specializing in data warehousing and data quality.


Fundamental Mind Shifts for the Future of Data Analytics
James Purchase
Data analytics requires a fundamental mind shift. Rather than continuing to use myopic information (such as concluded events, past transactions, and in-the-moment conversations), data analytics is entering a new stage—one that strings together historic data with current events, nuances, and (until now) largely unstructured pieces of data to create The Big Picture. With this new school of thought about measuring these strings of data—more colloquially referred to as measuring sentiment—how do companies that have been built on structured data shift their mindset to read the conversational context of data? How do they switch gears to combine history, linguistics, and algorithms to interpret human intention?
This article looks into the future of data analytics to explore how accurate measures of sentiment are, dive deeper into the granular subtleties of language for non-sentiment profiling, and build a timeline beyond sentiment that moves into actual profiling, context space influencing, and what will be the Holy Grail of analytics: dynamic search.
Learn more: Read this article by downloading the Business Intelligence Journal, Vol. 20, No. 2

Highlight of key findings from TDWI's wide variety of research
Best Practices for Next-Gen Analytics and Platforms
We asked respondents about other best practices related to next-generation analytics. In particular, we asked about whether they use a center of excellence and how they measure results over time.
Center of excellence. A CoE typically consists of a cross-functional team that provides leadership in analytics. The team might be responsible for working on analytics problems, training, and disseminating best practices. It evangelizes analytics. Thirty-four percent of respondents already have a CoE in place (not charted); an additional 30% are planning to in the next year or two. These teams can be useful because they help provide consistency and innovation across the organization.
Measuring results. An analytics culture is necessary when dealing with next-generation analytics. This culture is data-driven, which means results-driven. Results inform actions, a best practice for analytics, whether it is simply tracking key performance indicators or monitoring the results of more advanced models that get stale. How often you update a model depends on the model. It can be a period as long as six months or as short as daily (or shorter, depending on how advanced the model is).
We asked respondents how they measure results and improve over time. The results are presented in Figure 11. Twenty-eight percent did not measure results; an additional 9% did not adjust analytics, even if they did measure results. That means more than a third of respondents may not be data- or analytics-driven. About 40% of respondents measure and adjust analytics monthly. Fewer than 25% measure and adjust metrics more often than monthly.
(Click for larger image)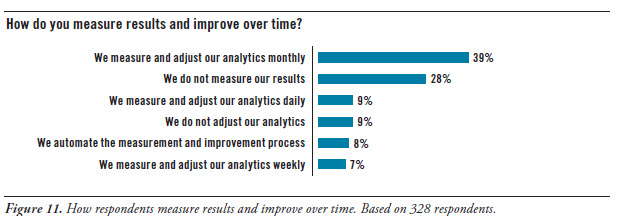
Read the full report: Download Next-Generation Analytics and Platforms (Q1 2015)


FlashPoint Rx prescribes a "Mistake to Avoid" for business intelligence and data warehousing professionals.
Mistake: Not Integrating Workflow and Process Management into MDM Solutions
Philip Russom
Earlier, we saw that master data management (MDM) involves (among other things) a complex collaborative process. Much of the collaborative process is a series of steps for proposing, reviewing, developing, and policing the business entity definitions and reference data standards that are the product of MDM.
Too often, development and collaborative efforts in MDM are mostly ad hoc actions with little or no process. MDM needs workflow functionality that automates the proposal, review, and approval process for newly created or improved reference data. Workflow helps an MDM program scale up and grow as it matures.
To help automate the process, some MDM tools now support workflows for proposing and approving business entity definitions. This kind of workflow usually works within a single tool. As a more sophisticated alternative, and for a broader scope, some organizations integrate their MDM solutions with tools for business process management (BPM), which can reach across multiple departments, IT systems, and business processes.
Read the full issue: Download Ten Mistakes to Avoid When Growing Your MDM Program (Q2 2015)

