 View online: tdwi.org/flashpoint


February 5, 2015
ANNOUNCEMENTS
NEW TDWI Checklist Report
Seven Steps for Executing a Successful Data Science Strategy
NEW TDWI Checklist Report
Evolving Big Data into a Mature Platform
CONTENTS

Discovery vs. Decision Analytics

Big Data Strategy Approaches: Business-Driven or
Discovery-Based?


Mistake: Failing to Expand User Access to New Big Data Sources

See what's
current in TDWI Education, Events, Webinars,
and Marketplace
Discovery vs. Decision Analytics
Nauman Sheikh
Data and Business Analytics Specialist
When a big data analytics project is initiated, the first thing your organization needs to understand is which type of analytics to start with: discovery or decision analytics. This article explains the differences between the two approaches, as well as strengths and weaknesses of each, so you can make a decision and set expectations accordingly.
Discovery Analytics
Discovery analytics, or exploratory analytics, is the more commonly touted capability an organization can acquire by investing in big data technology. The idea is that a big data platform is built with all possible data available from any source. Visualization and exploration tools are then used to discover insights.
Here is an example of how visualization and insights work from the film Iron Man 3. The character Tony Stark asks his computer, Jarvis, using natural language to:
- Find all reports of bomb explosions across all types of media sources
- Plot them in 3-D
Jarvis produces a visualization that plots all explosion reports across time and geography on a 3-D plane, with shades of red marking the intensity of each explosion. From this plot, Tony Stark is able to identify the explosions that stood out, and then goes after the earliest explosion to investigate.
Although the example is fiction, reality is not far removed. You can build a big data platform that collects information from various Internet sources and downloads all the structured and unstructured data to a Hadoop cluster, where processing algorithms will filter out the relevant information. Then a visualization tool can plot the output.
The two most important characteristics of discovery analytics, as evident from this example, are:
- Insight
- Causation analysis or investigation
In this example, insight was discovered by plotting the intensity of the explosions. If instead the number of deaths, time of day, or weather were used, there is no guarantee anything would have stood out. This is a significant challenge—a lot of trial and error may be needed before the desired insight is evident. It can also be tricky to identify when you have discovered a useful insight because there isn’t always a precise definition of “useful.”
The second characteristic of discovery analytics is causation, or the underlying causes of the insight discovered. The insight is the “effect” and causation is what leads to a business action.
Decision Analytics
Decision analytics focuses on day-to-day decisions already being carried out by business managers. The parameters of the decisions are well defined and understood, and knowledge of why and how the decisions are being made is available. The role of analytics in this case is to complement the existing process by predicting the outcome of the decision. This prediction is made available to the decision makers before they make a decision.
Let’s look at an example to understand decision analytics. Large and complex machines require routine maintenance. Through years of experience and analysis, engineers and their managers have developed a maintenance and part-replacement schedule. The decision to send a field engineer with the requisite parts and service equipment to the machine’s location is part of a fully integrated ecosystem across manufacturers, customers, resellers, and suppliers. Predictive analytics simply complements this existing process using a model that calculates the probability of a machine breaking down and provides proactive input to a manager to schedule the field staff.
Decision analytics heavily relies on predictive modeling to calculate the probability of an event occurring. It uses the data and information already available within the business process and data warehouse or data mart. The value proposition for such an analytics project will be immediately evident to the business. The only challenge will be when the business asks whether the model is accurate or how many false positives it will generate. You don’t want your field engineers running around fixing things that were not likely to break.
Predictive analytics, whether done using traditional statistical methods such as regression or using data mining methods such as neural networks, has strong model validation and testing methodologies widely available. Models can be run on historic data and compared with decisions already taken to demonstrate how the predictive model complements the existing decision-making process.
The benefit of decision analytics is the simplicity in its problem statement and solution explanation, but the challenges are tied to the art of predictive model building, which requires years of experience in the same problem domain. There is no guarantee that the model will perform at an acceptable level.
For example, if a model gets the correct decisions less than 50 percent of the time during validation, it implies a coin toss would be better suited to decision making. Decision analytics is easier to adopt but will eventually require discovery analytics for model improvement. Predictive models need to be fine-tuned and tested with newer variables over time as underlying business dynamics change.
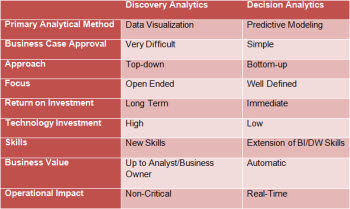
Discovery vs. Decision Analytics
Here is a comparison of the two methods. It is important to clearly understand which big data initiative is being considered and the expected challenges.
(Click for larger image)
Nauman Sheikh is a specialist in data and business analytics with a core focus on intelligent applications for risk management, big data, consumer analytics, and innovative use of predictive modeling. He is the author of Implementing Analytics: A Blueprint for Design, Development and Adoption (Morgan Kauffman, 2013).


Big Data Strategy Approaches:
Business-Driven or Discovery-Based?
Steve Williams
Since McKinsey Global Institute popularized the term big data in 2011, an explosion of marketing and sales activity has blurred the meanings of—and distinctions between—business intelligence, analytics, data warehousing, and big data. All manner of product companies, cloud providers, systems developers, and consulting firms have aligned their offerings to the new terminology.
For example, older, packaged reporting applications are now being marketed as big data analytics. New open source techni¬cal products designed to solve very specific data management challenges (such as management of unstructured data) of Internet-based companies are often promoted as potential replacements to traditional RDBMS products. The result is a combination of excitement at the potential for leveraging unstructured data, uncertainty as to big data’s business value, and architectural confusion.
This article sorts through the terminology and provides a straightforward way to formulate a company-specific big data strategy that optimizes business value and avoids undue risk.
Learn more: Read this article by downloading the Business Intelligence Journal, Vol. 19, No. 4

Highlight of key findings from TDWI's wide variety of research
Why Is Real Time Important?
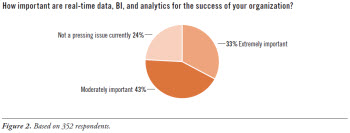
Anecdotally, TDWI has seen users’ needs for real-time technology increase noticeably since the new millennium began. To gauge the urgency of these needs, this report’s survey asked: “How important are real-time data, BI, and analytics for the success of your organization?” (See Figure 2.)
An appreciable 24% of respondents feel that real-time operation is not a pressing issue at this time. To the contrary, however, the majority of respondents consider real-time data, BI, and analytics to be extremely important for success (33%) or moderately important (43%).
(Click for larger image)
Read the full report: Download Real-Time Data, BI, and Analytics (Q4 2014)

FlashPoint Rx prescribes a "Mistake to Avoid" for business intelligence and data warehousing professionals.
Mistake: Failing to Expand User Access to New Big Data Sources
David Stodder
Organizations today are under pressure to enable access to multiple structured data sources as well as big data—semi-structured and unstructured sources such as text, social media data, and streaming machine data. This is particularly important for personnel in marketing, e-commerce, and customer sales and service functions who are interested in analyzing customer behavior across channels. If your organization is seeking to democratize BI and analytics to these users, you need to provide access to a wider range of data.
Business leadership should identify relevant sources and work with IT to determine which users and functions need to view which data sources. The tried-and-true strategy is to consolidate data from multiple sources into an enterprise data warehouse (EDW) that serves various users and business functions. Tasks for data mapping, profiling, discovery, ETL, and quality improvement then focus on what will go into the EDW.
However, this approach can be slow and impractical. Organizations should complement their consolidation strategy with data federation or virtualization. These modes use global metadata or master data to access “data in place” without having to move it to a central store. This is useful if data cannot be moved for regulatory reasons. The tasks to prepare the data and ensure its quality can be performed either through middleware or at the sources themselves.
Hadoop technologies offer another alternative. Organizations can implement Hadoop files to store “data lakes,” where the data is not restricted (as it is with an EDW) to just the acceptable types or structures. Working with raw data, users can be freeform in applying analytics. If users identify data that is worth moving into the EDW, IT can create ETL routines to make that happen.
Read the full issue: Download Ten Mistakes to Avoid When Democratizing BI and Analytics (Q4 2014)

