 View online: tdwi.org/flashpoint


June 5, 2014
ANNOUNCEMENTS
NEW TDWI Checklist Report
Seven Tips for Unified MDM with Data Quality and Data Governance
NEW TDWI Checklist Report
Active Data Archiving for Big Data, Compliance, and Analytics
NEW TDWI Checklist Report
Eight Steps for Using Analytics to Gain Value from Text and Unstructured Content
CONTENTS

Alternative Variable Selection Techniques for Enhanced Classification Models

Five Guiding Principles for Realizing the Promise of Big Data

The State of Predictive Analytics

Mistake: Not Understanding What Makes People Tick

See what's
current in TDWI Education, Events, Webinars,
and Marketplace
Alternative Variable Selection Techniques for Enhanced Classification Models
Tony Rathburn
The Modeling Agency
Topics:
Business Analytics
Using Proportional Variance to Rank Condition Attributes for Robust Analytics
One of the major issues facing an analyst in completing any analytic model is the selection of condition attributes.
In statistics, the coefficient of determination, termed R2 or R-squared, is a measure of how well data points fit a statistical model--the goodness of fit. R2 is a statistic, with a range of 0 to 1, and is commonly reported in a wide variety of statistical modeling techniques. It provides a measure of how well observed outcomes are replicated by the model as the proportion of total variation of outcomes explained by the model.
In linear regression, if an intercept is included, R2 is the square of the sample correlation coefficient between the outcomes and their predicted values. In the case of simple linear regression, it is the square of the correlation between the outcomes and the values of the single condition attribute being used for prediction. If an intercept is included and the number of condition attributes is more than one, R2 is the square of the coefficient of multiple correlation.
R2 and correlation coefficients are widely used in the ranking of potential condition attributes. Correlation coefficients are a dominant component of many variable selection approaches. They are, however, best suited to projects where the outcome being estimated is a continuous valued variable. For analytics projects where the outcome being estimated is a category or set of categories, the correlation coefficient may not provide optimal results.
Many business and government analytics projects are conceptualized to identify the propensity to display a behavior that impacts performance. These projects are inherently classification problems, usually structured with a binary outcome: 1 for those instances where the behavior has been displayed and 0 where the behavior is not displayed. Common examples include buyer behavior, fraud, and attrition/retention modeling.
The computation of proportional variance may offer a markedly different relative ranking of condition attributes, and often results in significantly higher levels of performance when used for condition attribute selection in classification projects.
Because the outcome is categorical and often binary, we are interested in selecting condition attributes that differentiate between the categories. In general, the stronger the proportion variance of a condition attribute relative to the outcome, the more important that condition is to our model.
If our candidate condition attribute is categorical, we begin by computing the percentage of observations displaying the behavior of interest for each category of the condition attribute. We can then compute the proportion of the total observations for each category based on the total number of observations displaying the behavior of interest. Finally, we compute the proportional variance by dividing the larger proportion by the smaller proportion.
For example, assume that you want to identify buyers in a data set of 1,000,000 customers. Using gender as a candidate condition attribute, you find that there were 19,716 buyers: 10,997 (1.10 percent) were women, and 8,719 (0.87 percent) were men. This results in a proportion of 55.78 percent women to 44.23 percent men, or a proportional variance of 1.26 (55.78/44.23).
If we consider a second candidate condition attribute of age, our data set has the same 1,000,000 customers and 19,716 buyers: 10,426 (1.04 percent) are over 25, and 9,290 (0.93 percent) are 25 or younger. This results in a proportion of 52.88 percent over 25, to 47.12 percent at 25 or younger--or a proportional variance of 1.12 (52.88/47.12).
In most classification projects, condition attributes with a larger proportional variance result in a more significant impact on our business performance metrics. In this example, we would want to bring the gender condition attribute into our model before the age condition. Additional condition attributes can then be added to a model and tested for their impact on performance.
Additional condition attributes would be considered based on their relative proportional variance. We could also compute the proportional variance for an interaction condition attribute, such as a combination of gender and age.
It is often a useful to compute the proportional variance of the outcome. From our example, assume that the 1,000,000 records had been compiled from a series of monthly mailings of 25,000 pieces a month for a little over three years. A basic analysis resulted in a mean response rate of 1.97 percent, with a standard deviation of .03 percent.
Assuming a desired 95 percent level of confidence, we would have a confidence interval for our response rate of 2.03 to 1.91 percent. Completing the proportional variance calculation in the same manner would result in a value of 1.06 percent.
This calculation is often a useful general reference in that it provides a baseline for the significance of candidate condition attributes. In practice we often find that the inclusion of condition attributes with a proportional variance smaller than the proportional variance of the outcome results in models that are over-specified and do not hold up under appropriate levels of testing and validation.
Tony Rathburn is a senior consultant and training director at The Modeling Agency, LLC. He is a frequent presenter at the TDWI World Conferences and will present the Thursday keynote at the TDWI World Conference in Boston, July 20–25, 2014.


Five Guiding Principles for Realizing the Promise of Big Data
Bhargav Mantha
Most organizations characterize big data in terms of volume, velocity, and variety, but it is more useful to consider big data in the same way we look at information management, analytics, and how they impact business decisions. After all, big data is a sweeping term that includes a variety of enterprise concerns, from managing and securing data sets to technologies that can analyze the data more quickly and thus enhance business value.
In this article, we outline five guiding principles to help companies make prudent investments and realize the promise of big data. Businesses should use these guidelines to help them think hard about when, where, and how to best realize big data’s value within their organizations.
Learn more: Read this article by downloading the Business Intelligence Journal, Vol. 19, No. 1


Highlight of key findings from TDWI's wide variety of research
The State of Predictive Analytics
Despite the challenges companies face, they still are experiencing value from predictive analytics. We asked the active group: “Overall, how satisfied are you with predictive analytics in your company?” Forty-four percent responded either “satisfied” or “completely satisfied,” 40% responded “neutral,” and only 16% were either “dissatisfied “or “completely dissatisfied.”
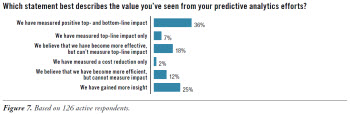
We also asked the active group what value they have measured using predictive analytics. (See Figure 7.) Forty-five percent of the respondents were able to measure a positive top- or bottom-line impact using predictive analytics. Another 30% believe that they have become more effective or efficient but have been unable to measure the impact. The remainder believes they have gained more insight from predictive analytics.
(Click for larger image)
Read the full report: Download Predictive Analytics for Business Advantage (Q1 2014)


FlashPoint Rx prescribes a "Mistake to Avoid" for business intelligence and data warehousing professionals.
Mistake: Not Understanding What Makes People Tick
Lyndsay Wise
Not understanding what motivates people to do what they do can create undercurrents in any project. Whether business sponsors or resources within IT, people are driven by factors other than following corporate demands. For example, some people are passionate about what they do, while others are frustrated by their lack of visibility into their data or their inability to make the changes they need without making requests to external resources.
Without understanding what makes people tick, project managers may encounter resistance to change or a lack of commitment to the project without knowing why. Evaluating what drives people will help develop a solution that is tailored to their needs. This includes helping them save time, make better decisions, and identify opportunities that may otherwise be outside their reach.
Additionally, looking at why people act as they do provides greater insight into the general divide between business units and IT departments. Different outlooks exist because of different goals and viewpoints. Consequently, understanding why people make the choices they do can help address infrastructure or ease of use. For instance, many IT decision makers will make choices that affect the broader IT infrastructure that extends beyond BI, which business sponsors also need to understand to create better cohesion between both groups.
Read the full issue: Download Ten Mistakes to Avoid When Bridging the Business/IT Divide (Q1 2014)

