 View online: tdwi.org/flashpoint


May 3, 2012
ANNOUNCEMENTS
New Best Practices Report:
Next Generation Master Data Management
New TDWI Checklist Report:
Data Replication for Real-Time Data Warehousing and Analytics
CONTENTS

Enrich Your Business Intelligence Program with Simulation
Value-Driven Reporting and Analytics

New Database Management Systems as Alternative Options

Mistake: Not Using Dimensional Design to Manage Scope

See what's
current in TDWI Education, Research, Webinars,
and Marketplace
Enrich Your Business Intelligence Program with Simulation
Mark Peco, CBIP
Topic:
Business Intelligence
Introductory Concepts
The term business intelligence (BI) has been in common use by organizations for several years. However, there are different levels of understanding about what the term actually means and what organizations should expect from it.
Early definitions positioned BI as an information delivery mechanism, usually associated with some form of a data warehouse or data mart. During the evolution from the late 1990s to the late 2000s, BI had a data and process perspective. Since then, the definition of BI has evolved to include a broader perspective related to enhancing an organization’s capabilities to “intelligently set and accomplish strategic and tactical goals.” This newer perspective implies that there is a need to broaden and diversify the scope and components found within a BI environment.
The modern concept of BI should include related approaches developed over the years by other disciplines, such as management science, operations, engineering, finance, and economics, Advances in these disciplines should be harmonized within a BI context if the modern definition of BI is to be realized.
Business Intelligence Context
A modern framework for BI should define the full range of components needed to achieve its broader vision related to “intelligent goal attainment.” From an architectural perspective, the following functional components are required for a modern BI program:
Business Value Generation
- Goal setting components for strategic and tactical business planning
- Work execution components for process and workflow management
- Decision-making components for problem framing and option selection
- Participation components for human capital and skills development
Monitoring and Learning
- Information delivery components for integration and reporting
- Measurement components for measures, metrics, and targets
- Analytics components for models and insight generation
- Technology components for the computing infrastructure
Leadership and Control
- Stakeholder components for information customers and investors
- Governance components for stakeholder priority and policy setting
Historically, BI programs have been too narrowly defined by the monitoring and learning components. To achieve the modern vision of BI, components that historically have been “business management centric” must now be considered as integrated components of the BI framework.
Analytics
Analytics can be defined as the discipline that uses mathematics, logic, and thinking skills to identify previously unknown relationships and patterns in various parts of an organization’s operations. Analytics can help generate insights and answer advanced “why” and “how” questions.
Analytics components include a wide variety of techniques that have been developed in many different disciplines, including statistics, data mining, optimization, simulation, and forecasting. These techniques are used to create mathematical models that define the relationships between different classes of variables that are important to an organization. There are different classes of relationships; these are supported by different classes of model-building techniques. The challenge is to harmonize these techniques to maximize the overall returns that BI investments can generate.
For example, deterministic relationships connect variables through well-understood rules expressed with equations and formulae. Stochastic relationships are expressed with statistical properties and probability distributions. Empirical relationships are discovered through observed evidence gathered through measurement and experimentation and then fitting curves to the observed data. Heuristic relationships are defined based on experience and implemented as rules of thumb. Each of these relationship categories exist within organizations and connect different types of variables through cause-and-effect linkages. Insights are generated when the variables that managers have influence over--decision variables--can be controlled and set at the levels required to create the desired output variables.
From Analytic Models to Simulation
Creating analytic models requires expertise in the mathematical techniques used to identify and codify the relevant data relationships. Model building in the field of predictive analytics is reserved for practitioners who understand the business domain and the mathematical techniques necessary to generate useful patterns and relationships. Statisticians and mathematicians typically play this role. Model building is analogous to software development. Software developers write the necessary code to build an application. However, simulation allows business users and decision makers to execute those models as a virtual laboratory to explore, investigate, and optimize areas of their interest.
Application Examples
Historically, simulation has existed and evolved within a variety of disciplines. The disciplines of engineering, operations, economics, and finance have strong traditions of using simulation techniques in the following areas:
- Strategy development
- Organizational change management
- Capital budgeting
- Production scheduling
- Product design
- Supply-chain management
- Equipment or facility evaluation and design
- Process improvement and redesign
- Pricing and revenue optimization
- Business optimization
Managing the Information Supply Chain
Simulation success is based on having sound data management practices to enable the core model development, calibrate the models over time, and manage the volumes of data produced as output. It is good practice to include simulation capabilities within the scope of a BI program because:
- Model creation is heavily dependent on available business data
- Simulation depends on parameters and data from available operations
- Results from simulation runs produce data that should be integrated into other BI solutions
- Models must be calibrated using data-intensive tuning techniques
- Simulation is not sustainable without a robust data management layer
- Existing measurement systems can be augmented with simulated values
- Simulation may indicate changing measurement and metrics requirements
- Setting new targets for existing and new business metrics can be based on simulation studies
Summary
As BI programs advance within organizations, they transition from basic reporting solutions to include more advanced techniques based on analytics. Enterprises are developing new competitive advantages by using simulation to improve their level of understanding about the factors driving observed business behavior. Simulation also reveals how they can combine decision variables so as to intelligently set and attain their goals. Simulation is data intensive and best managed within the context of BI programs that enable collaboration across a range of disciplines.
Mark Peco, CBIP, is a consultant and educator, holding degrees in engineering from the University of Waterloo. He is a partner with InQvis, a consulting firm based in Toronto, and is also a faculty member of TDWI.

Value-Driven Reporting and Analytics
David Loshin
Knowledge Integrity, Inc.
Topic:
Business Analytics
There is widespread market penetration among large companies of tools and programs supporting business intelligence (BI), reporting, and analytics. Now small and midsize businesses are beginning to explore how BI can benefit their organizations.
Yet, although these key organizational stakeholders are anxious to exploit big data, social media analytics, Hadoop, and other emerging technologies, they are often stymied from the get-go because they do not know where to begin. Unfortunately, there is ample evidence that driving a BI and analytics function purely from a technical standpoint is a nonstarter; projects attempting to drive business performance improvement and optimizations using this approach have typically stalled or been terminated.
Instead of focusing on the technology, we can reflect on Lord Kelvin’s famous quote, “If you cannot measure it, you cannot improve it,” which suggests that the initial focus be on the measurement of performance metrics. Although this idea provides subtext for the consideration of a BI project, the stumbling block is defining what is to be improved. This leads to three key questions:
- What aspects of the business will be measured?
- What do the measurements mean?
- What are the implications for “lift” upon improvement?
Without understanding how performance measurement maps to the business process, you cannot take advantage of reporting and analytics capabilities, no matter how sleek the technology looks.
An alternative to the technology-driven approach is one that considers the different facets of value to the business. This value-driven approach can help jump-start a BI capability by guiding the key stakeholders with concrete steps to properly scope an initial BI project:
- Consider key performance drivers within the organization
- Gauge levels of expectation for performance
- Propose measurable metrics
- Connect BI technology to process improvement
Essentially, performance metrics can reflect how the corporate mission and strategic performance objectives are translated into dimensions of value. This approach helps you determine the criteria for prioritizing effort in relation to maximizing value, especially when scoped to a specific program or business process. Understanding and prioritizing the desire to optimize a process for specific value improvements eventually drives the data requirements process by establishing the relationship between the selected value drivers and information assets available for reporting and analytics.
The business-driven approach is a virtuous cycle:
- Select an area of the business to improve and institute some types of measures
- Use those measures to establish a baseline of the current level of performance
- Consider targeted future levels of performance
- Assess the differences between the expected performance level and the current baseline
- Review the root causes of the gaps to identify alternatives for improvement
- Select one of the alternatives and adjust business processes to accommodate the opportunity for improvement
At this point, the measures instituted earlier to assess the baseline can be used to continue to monitor for improvement. If the desired benefits are not yet achieved, the cycle can begin again, focusing on the same area of the business. On the other hand, if the desired improvements are achieved, the cycle can be started on another area.
As an example, consider the performance measures associated with one frequently modeled, cross-functional business process: taking and processing orders. There are multiple stages in the order-to-cash process, as salespeople transcribe customer orders that are handed off to the fulfillment team. Items are picked from the inventory, placed in boxes, and shipped. Ultimately, when this process is performed with optimal efficiency, the value is reflected in financial terms; the shorter the entire process lasts, the more rapidly your business can issue an invoice and receive the payment, which positively impacts revenues and cash flow.
We begin with facets of financial value, but it quickly becomes evident that the financial value is directly related to efficiency. A number of productivity and efficiency measures are associated with measuring the success of this process, such as:
- Accuracy of orders
- Completeness of orders
- Number of orders changed
- Percentage of orders processed within the prescribed time frame
- Efficiency of packaging (do the items fit into the best-shaped boxes?)
- Efficiency of shipping (do the boxes fit most effectively into the shipping containers?)
The more you ponder the different aspects of efficiency, the more detailed the potential metrics become. In general, the value-based approach considers five high-level facets of corporate value: revenues (generating and increasing income), expenses (understanding and reducing costs), customer experience (ensuring customer satisfaction and its well-known benefits), risk (reducing or eliminating exposure to potential risks), and efficiency (including asset and staff productivity). Table 1 provides examples of facets of value and corresponding areas and typical measures.
(Click for larger image)
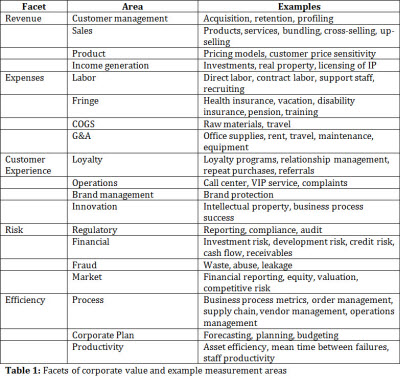
This table suggests potential high-level metrics; the more detailed information you solicit from the business process owners, the better you can describe even more precise metrics that can measure specific business value. These measures are the starting point--they enable the organization to both assess the current state and help set improvement objectives.
Yet there is still one ingredient necessary to make this nascent value-driven reporting and analytics work. Business intelligence capabilities deliver actionable knowledge to improve business value, and our reports and analyses will be, by design, targeted to address corporate business value drivers. However, the ultimate value is derived from taking action. Use this approach to begin measurement and monitoring of performance, look for opportunities to change, and then let the incremental success drive continuous maturation of reporting, analytics, and business intelligence capabilities.
David Loshin, president of Knowledge Integrity, Inc., is a recognized thought leader, TDWI instructor, and expert consultant in the areas of data management and business intelligence. David has written numerous books and papers on data management and is a frequent speaker at conferences, Web seminars, and sponsored Web sites and channels.

Highlight of key findings from TDWI's wide variety of research
New Database Management Systems as Alternative Options
In the survey for this report, TDWI asked, “What kind of storage engine would you prefer for data warehousing?” (See Figure 13.) A slight majority (51%) prefers a row-oriented storage engine. The fact that 42% prefer a column-oriented storage engine shows that the data warehouse community is aware of this somewhat new option. Oddly enough, no one would prefer to use both types of storage engines.
A few new vendors have emerged in recent years with DBMSs that support columnar data stores. This includes Infobright, ParAccel, and Vertica. And let’s not forget that Sybase IQ is a columnar DBMS that’s been available for about 10 years now. Sybase IQ proved the concept of the columnar data store early on, which makes it the “mother” of all columnar DBMSs.
(Click for larger image)

Source: Next Generation Data Warehouse Platforms (TDWI Best Practices Report, Q4 2009). Access the report here.

FlashPoint Rx prescribes a "Mistake to Avoid" for business intelligence and data warehousing professionals.
Mistake: Not Using Dimensional Design to Manage Scope
By Christopher Adamson
A dimensional model describes the measurement of a business process, reflecting how the process is evaluated by participants and observers. In this respect, it speaks clearly to the business users of the data warehouse. A dimensional model also has technical implications: it determines the data sources that must be integrated, how information must be cleansed or standardized, and how queries or reports can be built. In this respect, it speaks clearly to the developers of the data warehouse.
These dual perspectives make the dimensional design an ideal centerpiece for managing the scope of implementation projects. It is a blueprint that can be understood by all interested parties. The dimensional design provides a clear indication of work and capability and can be used as the basis for progress reporting. It can also serve as a nonambiguous arbiter of change requests. Changes that add dimensions or additional data sources, for example, are out of scope. This is particularly useful for organizations that employ iterative methodologies, but its simplicity makes it easy to reconcile with any development methodology.
Your data warehouse architecture will determine the breadth of the dimensional model, but does not prevent you from using it as a tool to manage implementation. Following the Kimball approach, dimensional design can guide project scope at an enterprise level and within data marts. In Inmon’s CIF, it can be used to define and manage a series of departmental data marts. Where standalone data marts are employed, it is used to manage a single subject area implementation.
Source: Ten Mistakes to Avoid In Dimensional Design (Q4 2009). Access the publication here.

