 View online: tdwi.org/flashpoint


April 5, 2012
ANNOUNCEMENTS
Submissions for the next Business Intelligence Journal are due May 18. Submission guidelines
CONTENTS

Performance Synergy: Leveraging Analytics with Predictive Modeling


Mistake: Assuming that Operational BI Is Just a Technology Solution

See what's
current in TDWI Education, Research, Webinars,
and Marketplace
Performance Synergy: Leveraging Analytics with Predictive Modeling
Thomas A. “Tony” Rathburn
The Modeling Agency
Topic:
Business Analytics
Overview
Although the importance of a basic level of literacy in analytics is a universally accepted prerequisite for today’s business manager, this foundation too often comes in a math context rather than in a decision-making context.
This issue is further exaggerated by the proliferation of business intelligence, data mining, and predictive analytics approaches that promote the importance of advanced mathematics and sophisticated technology over the fundamental purpose of enhancing business performance.
Recently, we have witnessed the proliferation of predictive analytics as a potential replacement technology to meet the challenges left unanswered by statistics.
This article explains why statistics and predictive analytics should be viewed as complementary technologies; each effectively enhances business performance.
The Business Motivation
Business decision makers are motivated by performance, not quantitative techniques. Business organizations are not, and should not, be viewed as centers of excellence in business intelligence, data mining, predictive analytics, data warehousing, or any other technology. Rather, our challenge is to utilize the best available technology to achieve our business objectives and enhance performance.
Predictive analytics is the goal-driven analysis of large data sets to enhance an organization’s performance (relative to its self-defined performance metrics) using a consistent, reliable strategy.
The competition between predictive analytics and statistics can be traced to 1956 and the Dartmouth Summer Conference on Artificial Intelligence. By the 1980s, the technologies of the Dartmouth Conference had evolved into a variety of specialties, and we began to see the application of these technologies to business applications, specifically in the effective handling of large quantities of data.
In general, organizations achieving successful implementation remained focused on the core business objectives and utilized available technology to continue to enhance performance; organizations focusing on technical solutions often failed to realize business application success.
Area of Interest: Central Tendency vs. Outliers
Statistics focuses primarily on the development of insights into the characteristics of a given population. Predictive analytics focuses on identifying the characteristics of groups that consistently display behaviors that result in events occurring in the tails of the distribution.
(Click to enlarge)
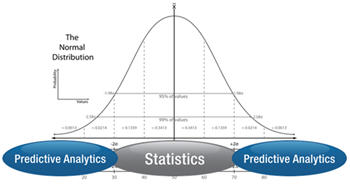
Statistical analysis gives us an “in-general” perspective of how a behavior is displayed, describes the central tendency, and explains the spread of outcomes we can anticipate. Predictive analytics identifies groups that consistently display a behavior at a rate significantly different from the central tendency.
In predictive analytics, we are describing characteristics that differentiate between the group that displays the behavior and those that do not. We are not developing a model that explains why individuals within a group display the behavior.
This contrast between statistics and predictive analytics illustrates the complementary nature of these two technologies. Understanding the inherent capabilities of each technology illustrates the area of the solution space where each technology may be most effectively applied. Business decision makers are well served to use this understanding and determine the needs of the problem they are working on and match the capabilities of the technology to their problem.
Behaviors of Interest
In a business environment, the decision maker is faced with the problem of determining who is likely to display a particular behavior within a large group.
Practitioners often focus their energies on complex quantitative techniques and attempt to gain higher and higher levels of precision in their analysis. In most cases, these practitioners would achieve more significant performance enhancements by focusing their energy on building dependent-variable constructs more closely aligned with the business problem than by completing complex, high-precision analysis of the model’s independent variables.
Relatively simple techniques, such as logistic regression, can focus on identifying groups that display a behavior at a rate significantly above or below the central tendency. This approach generally offers far more performance enhancement than one that attempts to implement additional precision.
Allocation of Scarce Resources
In marketing, for example, a group described by a set of characteristics “A,” “B,” and “C” may buy a product at a 2 percent rate while a group with a different set of characteristics (such as “X,” “Y,” and “Z”) may buy the same product at a significantly different rate.
It is easy to see that we have two distinct groups, defined by their characteristics. Additionally, they each contain a significantly different proportion of members who display the behavior of interest for the problem under consideration. In this case, the analyst would be better served by focusing on effective utilization of business resources based on the propensity of groups to display behaviors of interest rather than attempting to invest in strategies to manipulate behavior.
Quite simply, we can focus our analysis efforts on the groups with distinctly different rates of displaying a behavior that impacts business performance, and then allocate our resources to those groups that help our performance while avoiding allocation of resources to groups that hurt our performance.
Problem Types and Algorithms
The majority of techniques employed in predictive analytics are identical to those used in statistical analysis. Algorithms generate a formula. When we apply that formula to a set of data, we generate a line, which can be used for either predicting a value in a “forecasting” problem or as a boundary between two categories in a classification problem. For most business problems, practitioners would be well served to conceive their project as a classification problem.
Algorithms have no comparative valuation criteria. One is not “better” or “worse” than another. Each algorithm is a process for manipulating historical data and developing a set of variables, associated weights, and the operators that define the relationships between the weight/variable pairs.
Some algorithms, such as linear regression, are simply better suited to forecasting problems. Other algorithms, such as logistic regression, are better suited to classification problems. Appropriately matching an algorithm to the problem type is far more important than the utilization of “advanced analytics.”
The Bernoulli Distribution
Much analysis is completed using techniques that assume our data follows a normal distribution. In reality, human behavior data virtually never follows the normal distribution.
In constructing a classification project that develops a model discriminating between those who display a behavior and those who don’t, we can use a binary representation for our dependent variable. This approach allows us to adopt a large, established body of statistical methodology associated with the Bernoulli distribution and Bernoulli processes, including commonly desired metrics (such as confidence intervals and hypothesis testing) that are not based on normally distributed data.
Conclusion
The utilization of technology has grown rapidly and will likely continue to do so. The potential for today’s organizations lies in the effective utilization of technology to advance the business objectives of the organization, as measured by adopted performance metrics. Simple reliance of raw technology is not sufficient. Technology makes us efficient, not effective. Algorithms will never understand your business objectives.
Quantitative analysis offers many advantages when utilized appropriately. However, enhanced performance and competitive advantage is obtained by effective utilization of technology within the context of the stated business objectives of the organization.
A solid understanding of the core concepts of the available technologies, and learning to mesh the capabilities of those technologies to enhance organizational performance, is the key to the success of the modern organization.
Thomas A. “Tony” Rathburn is a senior consultant and training director with The Modeling Agency, and has over 25 years of data mining and predictive modeling project experience across a broad range of industries and application areas. Tony has been a regular presenter of predictive analytics and data mining courses at TDWI World Conferences since 2003.


Highlight of key findings from TDWI's wide variety of research
Processing Architectures
Symmetrical multi-processing (SMP) will suffer declining usage (-44% delta), despite a moderate commitment (36% plan to use it) and three decades of successful use in data warehousing. How could a technology so entrenched in data warehousing decline so quickly? Well, in a complementary trend, massively parallel processing (MPP) is poised for good growth (46% delta) fueled by good commitment (58% plan to use it). In a sense, these are competing and complementary technologies. Many users have plans to migrate from SMP to MPP when they next change their data warehouse platform.
To further quantify users’ desires for MPP, the TDWI survey for this report asked what their processing architecture is today versus what they’d prefer. (See Figure 11.) Today, roughly two-thirds have SMP, and one-third has MPP. In terms of what respondents would prefer, the numbers shift to one-third SMP and two-thirds MPP.
(Click for larger image)
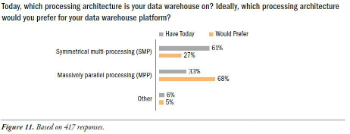
Source: Next Generation Data Warehouse Platforms (TDWI Best Practices Report, Q4 2009). Access the report here.

FlashPoint Rx prescribes a "Mistake to Avoid" for business intelligence and data warehousing professionals.
Mistake: Assuming that Operational BI Is Just a Technology Solution
By Claudia Imhoff and Colin White
It’s critical that BI implementers be able to tie BI applications to operational applications and, even more important, with operational processes. Yes, technology is important, but perhaps just as important are the standard operating procedures (SOPs) that must be followed by business personnel. Many BI implementers do not realize that their OBI solution impacts how people perform their jobs. Without understanding how SOPs will be affected, the OBI team can cause severe problems with operations or, worse, find their solutions being ignored or circumvented.
As a first step, the BI team should study, understand, and document the full business workflow using the new BI application. OBI applications can cause big changes to processes and procedures. When they do, the team must determine how the SOPs must change: Will they need to be rewritten or enhanced to include the new OBI application? What impact will this have on the workforce? Who will create and maintain the new SOP?
The team must also determine which personnel will be affected by the new procedures and what training they will need. This means studying how these personnel make decisions, how they access and use information, and how they monitor the impact of their decisions on the company. Training must be ongoing and flexible to accommodate the inevitable turnover in operational personnel. Some of the workforce may immediately grasp this new paradigm; others may not.
Source: Ten Mistakes to Avoid When Designing and Developing Operational BI Applications (Q3 2009). Access the publication here.

